
26.07.2020
Pasadena, CA— Filling in the most-significant gaps in our understanding of the universe’s history, the Sloan Digital Sky Survey (SDSS) released Sunday a comprehensive analysis of the largest three-dimensional map of the cosmos ever created.
The survey, of which Carnegie is an integral member, has been one of the most successful and influential in the history of astronomy. It operates out of both Apache Point Observatory in New Mexico, home of the survey’s original 2.5-meter telescope, and Carnegie’s Las Campanas Observatory in Chile, where it uses Carnegie’s du Pont telescope.
The new results come from the extended Baryon Oscillation Spectroscopic Survey (eBOSS), an international collaboration of more than 100 astrophysicists that is one of the SDSS’s component surveys. At the heart of the new results are detailed measurements of more than two million galaxies and quasars covering 11 billion years of cosmic time.
“We know both the ancient history of the universe and its recent expansion history fairly well, but there’s a troublesome gap in the middle 11 billion years,” says cosmologist Kyle Dawson of the University of Utah, who led the team announcing these results. “For five years, we have worked to fill in that gap, and we are using that information to provide some of the most substantial advances in cosmology in the last decade.”
This map represents the combined effort of more than 20 years. A close look reveals the filaments and voids that define the structure in the universe, starting from the time when it was only about 300,000 years old. Using it, researchers measure patterns in the distribution of galaxies, which give several key parameters of our universe to better than one percent accuracy.
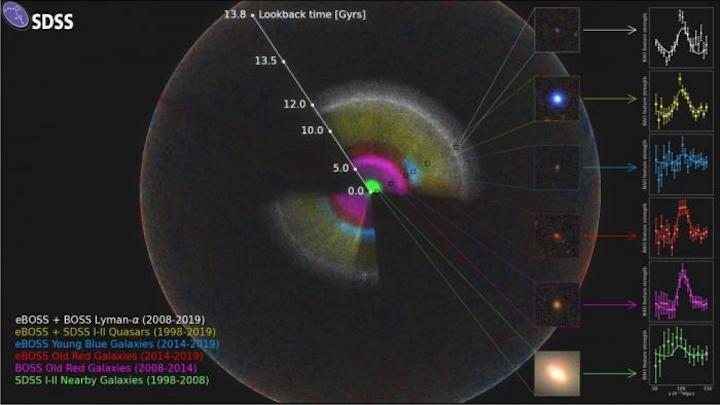
The SDSS map is shown as a rainbow of colors, located within the observable universe (the outer sphere, showing fluctuations in the Cosmic Microwave Background). We are located at the center of this map. The inset for each color-coded section of the map includes an image of a typical galaxy or quasar from that section, and also the signal of the pattern that the eBOSS team measures there. As we look out in distance, we look back in time. So, the location of these signals reveals the expansion rate of the universe at different times in cosmic history. Image is courtesy of Anand Raichoor (EPFL), Ashley Ross (Ohio State University), and the SDSS Collaboration.The map also shows that expansion of the universe began to accelerate about six billion years ago and has continued to get faster and faster ever since, believed to be due to the mysterious force called “dark energy.” In particular, the eBOSS team’s measurement of the current rate of the universe’s expansion—called the Hubble Constant after Carnegie astronomer Edwin Hubble, who discovered that the universe has been growing continuously since it exploded into being during the Big Bang—is about 10 percent lower than some values found from distances to nearby galaxies. The high precision of the eBOSS data means that it is highly unlikely that this mismatch is due to chance, and the rich variety of eBOSS data gives us multiple independent ways to draw the same conclusion.
There is no broadly accepted explanation for this discrepancy in measured expansion rates, but one exciting possibility is that a previously unknown form of matter or energy from the early universe might have left a trace on our history.
eBOSS leaves the puzzle of dark energy, and the mismatch of local and early universe expansion rate, as a legacy to future projects. In the next decade, future surveys may resolve the conundrum, or perhaps, will reveal more surprises.
Meanwhile, with continued support from the Alfred P. Sloan Foundation and institutional members, the SDSS is nowhere near done with its mission to map the universe. Karen Masters of Haverford College, spokesperson for the current phase of SDSS, described her excitement about the next one.
“The Sloan Foundation Telescope and its near-twin at Las Campanas Observatory will continue to make astronomical discoveries mapping millions of stars and black holes as they change and evolve over cosmic time.”
The SDSS team is busy building the hardware to start this new phase and is looking forward to the new discoveries of the next 20 years. Its fifth generation, SDSS-V, directed by Carnegie astronomer Juna Kollmeier, will map the entire sky.
“SDSS has transformed the way we do astronomy, with each phase pushing the boundary of what is considered possible,” said Kollmeier. “The eBOSS cosmology results are no exception, filling in an important gap in our measurements of cosmic evolution and demonstrating the collaborative power of the SDSS consortium.”
The SDSS team is busy building the hardware to start this new phase and is looking forward to the new discoveries of the next 20 years.
Quelle: Carnegie Institution for Science
+++
ASTROPHYSICISTS FILL IN 11 BILLION YEARS OF UNIVERSE EXPANSION HISTORY
Before eBOSS, it was as if we had this movie of the Universe but with most of it missing. We had some images of the beginning and we could see how the story ends, but now, thanks to eBOSS, we can finally see most of the Universe's tale and how dark energy was one of the main actors in it.
Professor Kyle Dawson, of the University of Utah, led the team announcing today’s results. He said: “We know both the ancient history of the Universe and its recent expansion history fairly well, but there’s a troublesome gap in the middle 11 billion years. For five years, we have worked to fill in that gap, and we are using that information to provide some of the most substantial advances in cosmology in the last decade.”
Scientists know what the Universe looked like in its infancy, thanks to the thousands of experts from around the world who have measured the relative amounts of elements created soon after the Big Bang, and who have studied the Cosmic Microwave Background. They also know its expansion history over the last few billion years from galaxy maps and distance measurements, including those from previous phases of the SDSS.
The final map is shown in the below image. A close look at the map reveals the filaments and voids that define the structure in the Universe, starting from the time when the Universe was only about 300,000 years old. From this map, researchers measure patterns in the distribution of galaxies, which give several key parameters of our Universe to better than one per cent accuracy. The signals of these patterns are shown in the insets in the image.

The SDSS map is shown as a rainbow of colours, located within the observable Universe. Image Credit: Anand Raichoor (EPFL), Ashley Ross (Ohio State University) and the SDSS Collaboration
This map represents the combined effort of more than 20 years of mapping the Universe using the Sloan Foundation telescope. The cosmic history revealed in this map shows that about six billion years ago, the expansion of the Universe began to accelerate, and has continued to get faster and faster ever since.
Dr Bautista said: “We think this acceleration is due to an invisible component of the Universe we call ‘dark energy’, but we don’t understand well how dark energy behaves. It could just be a cosmological constant as suggested by Einstein, but that is extremely difficult to reconcile with theories of particle physics.
“Before eBOSS, it was as if we had this movie of the Universe but with most of it missing. We had some images of the beginning and we could see how the story ends, but now, thanks to eBOSS, we can finally see most of the Universe's tale and how dark energy was one of the main actors in it.”
Combining observations from eBOSS with studies of the Universe in its infancy reveals cracks in this picture of the Universe. In particular, the eBOSS team’s measurement of the current rate of expansion of the Universe (the “Hubble Constant”) is about 10 per cent lower than the value found from distances to very nearby galaxies. The high precision of the eBOSS data means that it is highly unlikely that this mismatch is due to chance, and the rich variety of eBOSS data gives us multiple independent ways to draw the same conclusion.
There is no broadly accepted explanation for this discrepancy in measured expansion rates, but one exciting possibility is that a previously-unknown form of matter or energy from the early Universe might have left a trace on our history.
In total, the eBOSS team made the results from more than 20 scientific papers public today. Those papers describe, in more than 500 pages, the team’s analyses of the latest eBOSS data, marking the completion of the key goals of the survey.

This image illustrates the impact that the eBOSS and SDSS maps have had on our understanding of the current expansion rate and curvature of the Universe from the last 20 years of work. The grey region shows our knowledge as of 10 years ago. The blue region shows the best current measurement, which combines SDSS, eBOSS and other programmes. Image Credit: Eva-Maria Mueller (Oxford University) and the SDSS Collaboration
Within the eBOSS team, individual groups at universities around the world focused on different aspects of the analysis. To create the part of the map dating back six billion years, the team used large, red galaxies. Farther out, they used younger, blue galaxies. Finally, to map the Universe eleven billion years in the past and more, they used quasars, which are bright galaxies lit up by material falling onto a central supermassive black hole. Each of these samples required careful analysis in order to remove contaminants, and reveal the patterns of the Universe.
eBOSS, and SDSS more generally, leaves the puzzle of dark energy, and the mismatch of local and early Universe expansion rate, as a legacy to future projects. In the next decade, future surveys may resolve the conundrum, or perhaps, will reveal more surprises.
Professor Adam Amara, the newly appointed Director of the ICG who starts next month, said: “These are very exciting results coming from decades of developments from the SDSS team. It is wonderful to see my cosmology colleagues at the ICG continuing to play leading roles in these important international collaborations.”
Quelle: UNIVERSITY OF PORTSMOUTH