
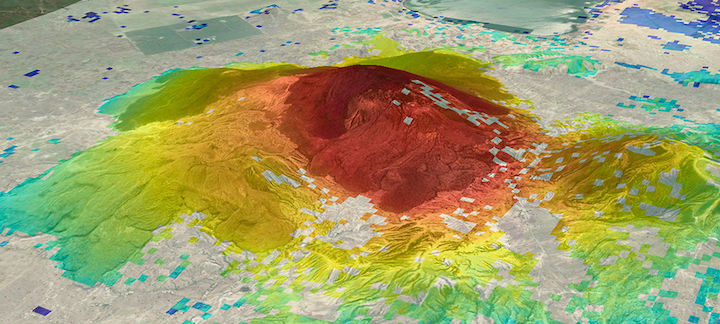

The surface of Ethiopia’s Corbetti volcano has been rising nearly 7 centimeters per year, a sign of underground activity. In this image, red shows the most cumulative inflation.
East Africa has been called the cradle of humanity. But the geologically active region has also given birth to dozens of volcanoes. Few have been monitored for warnings of a potential eruption, and until recently, most were believed to be dormant. Then, Juliet Biggs decided to take a closer look—or rather, a farther look.
Biggs, a geophysicist at the University of Bristol, uses a technique called interferometric synthetic aperture radar (InSAR) to detect tiny movements of Earth’s surface from space. In a series of studies, she and her co-authors analyzed satellite data on the East African volcanoes. According to their latest results, which were published last month, 14 have been imperceptibly growing or shrinking in the past 5 years—a clue that magma or water is moving underground and that the volcanoes are not completely asleep. “It’s really changed the way these volcanoes are viewed, from something that’s kind of dormant to really very active systems,” Biggs says. After data showed that the Corbetti volcano, which abuts the fast-growing city of Hawassa, Ethiopia, is inflating steadily at a rate of 6.6 centimeters per year, Biggs’s Ethiopian colleagues included it in the country’s geological hazard monitoring network.
No other technology could produce such a comprehensive survey. Individual GPS stations can track surface movements of less than 1 millimeter, but InSAR can measure changes almost as subtle across a swath hundreds of kilometers wide. That has made it a vital tool for earth scientists studying the heaves and sighs of our restive planet. “We tend to think of the ground as this solid platform,” Biggs says, “and actually, it’s really not.”
With InSAR, scientists are tracking how ice streams flow, how faults slip in earthquakes, and how the ground moves as fluids are pumped in or out. “Everywhere you look on Earth, you see something new,” says Paul Rosen, an InSAR pioneer at NASA’s Jet Propulsion Laboratory (JPL). “It’s a little bit like kids in a candy store.”
And the flood of InSAR data is growing fast. Since 2018, the number of civil and commercial SAR satellites in orbit has more than doubled. And at least a dozen more are set to launch this year, which would bring the total to more than 60. With the help of computing advances that make data processing easier, the satellite fleets may soon be able to detect daily or even hourly surface changes at just about every patch of ground on Earth.

A port explosion rocked Beirut in August 2020. Before-and-after radar images were used to identify areas (red) with surface changes due to damaged buildings.
As the technology grows more powerful and ubiquitous, InSAR is spreading beyond the geosciences. With InSAR data, railroads are monitoring the condition of their tracks and cities are monitoring shifts in buildings caused by construction. “It’s popping up everywhere,” says Dáire Boyle, who follows trends in the space industry for Evenflow, a consulting firm in Brussels. Analysts value the SAR market at roughly $4 billion, and expect that figure to nearly double over the next 5 years.
Many believe InSAR will eventually underpin our daily lives. From measuring the water stored in mountain snowpacks to enabling quick responses to natural disasters, InSAR data will prove invaluable to governments and industries, says Cathleen Jones, a science team leader for NISAR, an upcoming joint SAR mission from NASA and the Indian Space Research Organisation (ISRO). “I want it to become so socially relevant that they can’t go back to not having this data.”
SYNTHETIC APERTURE RADAR, the “SAR” on which InSAR depends, originated in the 1950s as a tool for airborne military reconnaissance. Like traditional radar, SAR instruments captured images of the planet by sending out microwave pulses and recording the echoes. And like a traditional radar, the instruments could penetrate clouds and worked equally well at night. A key difference was the “synthetic” aspect of SAR. Larger radar antennas, like larger apertures on a camera, collect more of the echoes and enable sharper pictures. But building a single antenna large enough to take a high-resolution image isn’t practical. Researchers realized they could instead create an artificially large aperture by combining the signals received on a much smaller antenna as it moved through space. Today, SAR satellites with antennas just a few meters across can produce images with pixel resolutions as sharp as half a meter—better than many satellite-borne cameras.
SAR images, on their own, suffice for many types of surveillance, from counterterrorism to tracking oil spills in the ocean. But InSAR goes further, by looking for differences between multiple SAR images. The technique takes advantage of phase information in the returning microwaves—in other words, where a signal is in its sinusoidal path when it hits the antenna. Any phase difference in the signal between SAR images taken from the same position at different times means the round-trip distance has changed, and can reveal surface movements down to a few millimeters. “There’s nothing else that compares to it,” says Michelle Sneed, a hydrologist at the U.S. Geological Survey. “I’m still amazed by it after a couple of decades.”
Rulers of Earth
A remote sensing technique called interferometric synthetic aperture radar (InSAR), first demonstrated more than 30 years ago, is reaching its heyday. By comparing radar imagery gathered over time, researchers can detect ground motions as small as a few millimeters.
The 1978 launch of Seasat, NASA’s first ocean-observing satellite, provided data for early InSAR efforts. Seasat operated for just 105 days before a power failure brought the mission to an untimely end. But in that time, it collected repeat images of California’s Imperial Valley taken over the course of 12 days. Scientists at JPL later compared those images using InSAR to show the subtle swelling of fields as they soaked up irrigation water. “It is not hard to think of numerous applications for the type of instrument demonstrated,” the authors wrote in a 1989 paper. And they were right.
A classic InSAR study came in 1993, when a team of scientists in France used data from the SAR-enabled European Remote Sensing satellite to study a powerful earthquake that rocked Landers, California, the year before. By analyzing images taken before and after the quake, they calculated that the fault had slipped by up to 6 meters, which agreed with detailed field observations. The InSAR data also revealed how the ground buckled for kilometers around the fault—illustrating the full effects of the temblor at an unprecedented scale.

Changes between radar images taken before and after 2019 earthquakes in Ridgecrest, California, reveal slip along perpendicular faults. Each color cycle represents 11.5 centimeters of ground motion.
The paper inspired scientists like Sneed, who went on to use InSAR to study how groundwater extraction causes the ground to sink. During a drought in California’s San Joaquin Valley in the late 2000s, she and her colleagues discovered that the surface was subsiding as fast as 27 centimeters per year in places where farmers pumped the most groundwater. Irrigation canals were sagging as a result of uneven sinking, impeding water flow. “It’s a really expensive problem,” Sneed says. (Another recent InSAR study linked specific water-intensive crops—notably corn, cotton, and soy—to increased subsidence.)
Glaciologists adopted the technology, too. As a young researcher at JPL in the 1990s, Ian Joughin used InSAR—which tracks both vertical and horizontal movements—to measure the speed of polar ice streams. Some scientists thought flow rates would be relatively immune to climate change. But, sadly for the world, InSAR studies by Joughin and others proved those predictions wrong. “Especially in the early 2000s, we just saw all kinds of glaciers double their speed,” says Joughin, who now studies the fate of polar ice sheets and their contribution to sea-level rise at the University of Washington, Seattle.
High water marks
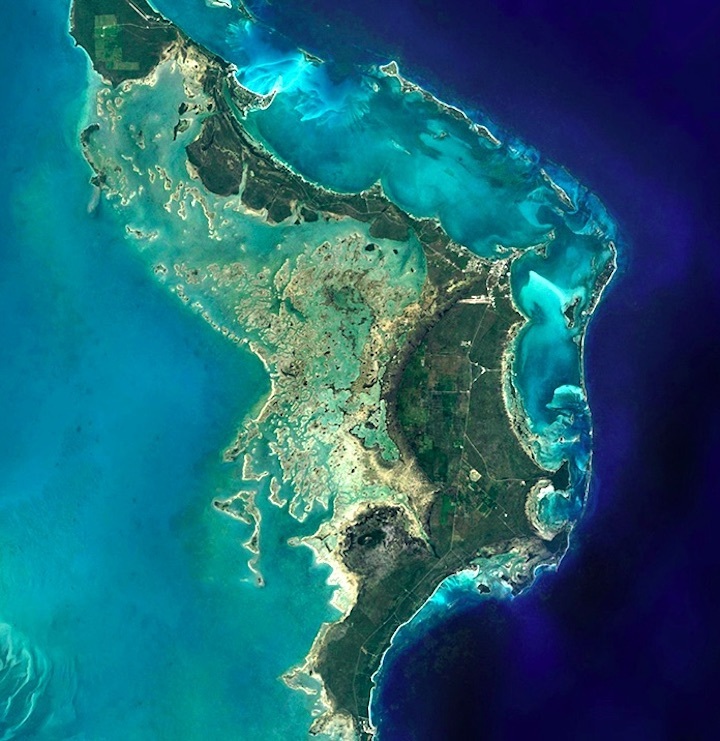
Flooding damage in the Bahamas, from Hurricane Dorian in 2019, was remotely assessed by NASA’s Jet Propulsion Laboratory and the Earth Observatory of Singapore using synthetic aperture radar (SAR) data from Europe’s Sentinel-1-satellites. By comparing SAR images acquired before and after the hurricane, researchers can see shifts in ground surface related to flooding. (Yellow, orange and red indicate increasingly substantial surface change.) A surge in SAR data is enabling researchers to study changes like these at finer scales and frequencies.
By the 2000s, many earth scientists were using InSAR—and grappling with its limitations. There were few SAR satellites in orbit, and they tended to switch between instruments or imaging modes to accommodate different users’ needs, making the data hard to use for InSAR. The early missions collected the repeat images needed for InSAR only about once a month, and researchers often had to correct for their wobbly orbits. That meant that although scientists could study an event after it happened, they could rarely watch it unfold in real time.
Leaders at the European Space Agency (ESA) were convinced there was a better way.
MALCOLM DAVIDSON REMEMBERS the excitement and anxiety he felt on 3 April 2014, the day the first Sentinel-1 satellite launched. “All your life goes into a few minutes,” says Davidson, mission scientist for ESA’s flagship SAR program. He also remembers the relief when the satellite safely reached orbit, and the awe that came over him when he saw its first image, of ocean swells. “It was very convincing that the mission was going to do great things,” he says.
With Sentinel-1, the plan was simple: “We cut out all the experiments, and we said, ‘Look, this is a mapping machine.’” He and his colleagues chose a primary imaging mode to use over land—surveying a 250-kilometer swath at a resolution of 5 meters by 20 meters—that they hoped would satisfy most researchers, and made sure the orbits would overlap precisely, so all the data would be suitable for InSAR. The first satellite, Sentinel-1a, retraced its path every 12 days. Then, in 2016, ESA launched a clone that made repeat images available about every 6 days for many places on Earth.
SAR missions like Italy’s COSMO-SkyMed and Germany’s TerraSAR-X also support InSAR and can achieve even higher resolutions. But they do not distribute data freely like Sentinel, which many credit for driving a transition from opportunistic experiments to what Davidson sees as “a more operational view of the world.” With Sentinel-1 data, Norway created a national deformation map that has helped identify rockslide hazards and revealed that parts of Oslo’s main train station were sinking. Water managers in California rely on the data to track groundwater use and subsidence. And in Belgium, it is used to monitor the structural integrity of bridges. “It can all be done remotely now, saving time, saving money,” Boyle says.

Norway’s national deformation map, based on InSAR data from Sentinel-1 satellites, showed parts of Oslo’s train station sinking (red dots) by more than 1 centimeter per year, perhaps because of nearby construction.
The large and growing body of InSAR data has also revealed small surface movements that were previously hidden by noise. As radar signals pass through the atmosphere, they slow down by an amount that depends on the weather, producing variability that can swamp tiny but important displacements. Thanks to long-term records from missions like Sentinel, researchers can now tease information from the noise, for example, helping them track movements of just a few millimeters per year in Earth’s crust—enough to strain faults and eventually cause earthquakes.
Such efforts would not have been possible without huge gains in computing power. In the 1990s, stacking a single pair of SAR images could take days, Sneed says, and interpreting the results could take much longer. Now, researchers can process hundreds of images overnight, and they increasingly rely on artificial intelligence (AI) algorithms to make sense of the data. In one recent test, an AI algorithm was tasked with identifying small fault movements known as slow earthquakes. It correctly found simulated and historical events, including ones that had eluded human InSAR experts, says Bertrand Rouet-Leduc, a geophysicist at Los Alamos National Laboratory who presented preliminary results in December 2020 at the annual meeting of the American Geophysical Union.
Rouet-Leduc and his team now plan to monitor faults around the world using the same approach. He says it’s mostly a matter of exploiting the vast quantity of data that “sits on servers without being looked at,” because it’s simply too much for scientists to tackle. The researchers hope they will be able to answer questions like when and why slow earthquakes happen, and whether they can trigger big, damaging events by increasing stress on other parts of a fault.

InSAR is being used to identify instabilities in pit mines that could lead to slope failures.
Commercial users often lack the expertise to process InSAR data, so hundreds of companies have sprung up to help. One, Dares Technology, monitors the ground for the construction, mining, and oil and gas industries. By tracking surface changes as fluids are injected or extracted from an oil reservoir, for example, Dares can help companies estimate pumping efficiency and prevent dangerous well failures.
In the beginning, convincing clients that InSAR data were useful and trustworthy was difficult, says Dares CEO Javier Duro. Now, he says, “Everybody wants to include InSAR in their operations.” Duro is particularly interested in detecting precursors to accidents, for example, by looking for signs of instability in the walls of open-pit mines or in the dams used to store mine tailings. The company usually sends out several alerts per month to clients, who can take actions to avoid disasters. “Typically, InSAR data have been used for back analysis,” Duro says. “Our mission is to focus on the present and the future, and try to predict what could happen.”
THE SURGE IN SATELLITES promises to bring yet another InSAR revolution. Italy, Japan, Argentina, and China all plan to launch additional SAR satellites soon, and NISAR, the NASA-ISRO mission, will take flight in late 2022 or early 2023. NISAR will image Earth’s full land surface every 6 days, on average, says Rosen, the mission’s project scientist. Its two radar sensors will help researchers track many things, including crop growth and changes in woody biomass—crucial for understanding the climate system. With a better view of Antarctica than other missions, NISAR can also monitor changes in ice.
Taken together, Sentinel-1, NISAR, and the other civil satellites will image most places on Earth at least every 12 hours, Rosen says. But the temporal resolution of InSAR will remain constrained by the revisit rate of the individual missions, because the technique can’t be done with imagery from different missions. However, private companies with large constellations of microsatellites hope to vault the field into yet another realm, by radically increasing revisit frequencies.
On 24 January, a SpaceX Falcon 9 rocket blasted off from Cape Canaveral, Florida, carrying three satellites, each about the size of a minifridge and weighing less than 100 kilograms, from Iceye. The Finnish SAR startup has raised more than $150 million toward its audacious goal of imaging every square meter of Earth every hour.
The launch brought Iceye’s commercial constellation to six, giving it an early lead over rival companies such as Capella Space—which had two satellites on the same rocket—and Umbra, both based in California. Iceye plans to add at least eight more satellites this year, allowing it to revisit most of the globe once a day. “That is groundbreaking,” says Pekka Laurila, who co-founded Iceye as an undergraduate at Aalto University and now serves as the company’s chief strategy officer.
Ultimately, Iceye hopes to assemble a constellation of as many as 100 satellites as it approaches its hourly monitoring objective. That would open up new applications, like tracking how buildings and dams expand during the heat of the day and contract at night—a clue to their structural integrity. Already, Iceye data have been used to guide ships through Arctic sea ice and to track illegal fishing vessels. “If you can work closer to real time, you can actually do something about it,” Laurila says.
So far, though, Iceye has focused on flood monitoring, which can guide disaster response efforts. In fact, the company provided some of the first images of Grand Bahama after Hurricane Dorian devastated the island in 2019, Laurila says. Precise flood data are also valuable to insurers, who can use them to trigger automatic insurance payouts after an event instead of processing claims and sending out inspectors. Until now, Iceye has tracked floods using regular SAR data, but it hopes to start to apply InSAR as it increases its revisit frequencies, because the technique can measure the height and extent of inundation much more precisely.
And that’s just the beginning of what Laurila hopes Iceye will do. His ultimate goal is to build a “new layer of digital infrastructure” that will provide a “real-time, always-available, objective view on the world,” he says. He believes that, like modern GPS, reliable SAR and InSAR data will support myriad applications, many of which have yet to be imagined. “Nobody thought of your Uber and pizza delivery when they thought of GPS,” Laurila says.
If Iceye and its peers succeed, they will expose the shifts and shudders of the planet, day in and day out. They will spy tilting buildings and slumping slopes, and they will witness the growth of crops and the flow of commodities around the world. If space-based imagery often portrays Earth as quiet and still, InSAR reveals the true restlessness of our living planet.
Quelle: AAAS