
28.09.2016
.
LIVING WITH A COMET: A VIRTIS TEAM PERSPECTIVE
Rosetta’s VIRTIS instrument (Visible and Infrared Thermal Imaging Spectrometer) has collected over 200 million spectra concerning the nature of Comet 67P/C-G’s nucleus and the gases in the coma. Principal Investigator Fabrizio Capaccioni gives the behind the scenes story of two top VIRTIS science discoveries, that is, after an initial rough start…
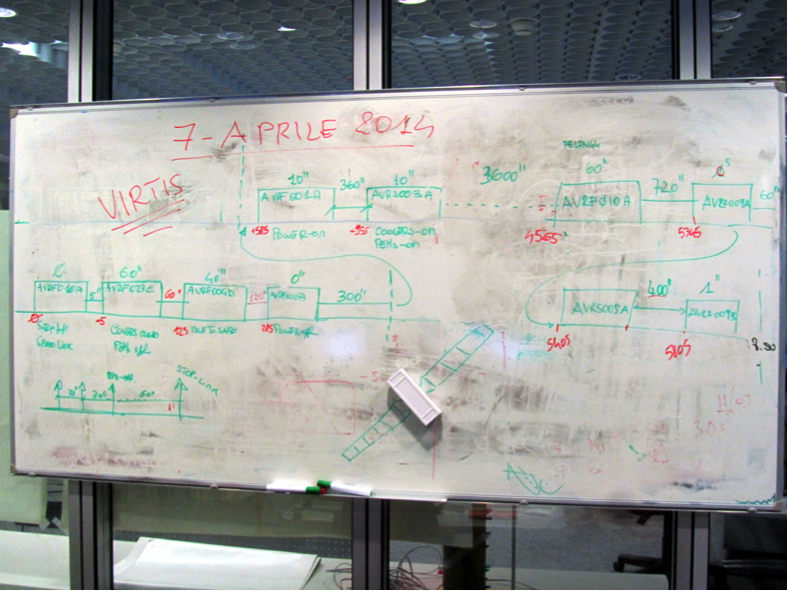
Redesigning the VIRTIS initialization procedure on the fly. Photo courtesy F. Capaccioni
A rather critical time for the VIRTIS instrument as a whole was when we performed the commissioning activities in the night of 7 April 2014. After 2.5 years of hibernation we were quite tense and also a bit rusty in the instrument handling; in fact, we ended up uploading the wrong telecommand sequences! The onboard software was much smarter then we were (after all, it had relaxed for 2.5 years) and gave us a lesson, sending back a flurry of unpleasant comments directed to us and to some of our relatives (including the deceased ones…)! We did not expect to have made mistakes, so we got really scared when the instrument responded as it did. The worst thoughts came to our minds: was it a broken sensor? A faulty component? All those years of expectations and planning, for what?
We had to quickly verify the received housekeeping data and the uploaded sequences as we didn’t have much time: we had an interactive session of only few hours and we had many checks to do.

Toasting an eventually successful ‘wake-up’ of the VIRTIS instrument in April 2014. From left to right Andrea Cicchetti, Me, Sophie Jacquinod, Stephane Erard, Stefano Giuppi, Florence Henry, Roberto della Porta and Gianrico Filacchione. Photo courtesy F. Capaccioni
An accurate verification of the parts in small print of the user manual got us back on our feet. We indeed had reversed the order of some telecommanding calls, and we had to go back to the sequences uploaded in the “Cruise Phase” and redesign the initialisation procedure in few minutes, hoping not to have made any further mistakes. Thanks to all the people involved everything went well and the onboard software was finally satisfied. We remained on good terms with the onboard software ever since.
And it was a good thing too, as VIRTIS was set to make a lot of discoveries at Comet 67P/Churyumov-Gerasimenko, including the first identification of widespread presence of organic materialon the surface of a cometary nucleus…but it wasn’t plain sailing, as Fabrizio reveals.
In the early phase of the mission (July-September 2014) the infrared region between 1 and 5 microns was our favourite spectral range because it was where we were expecting to identify the major compounds: water ice, carbon dioxide, methanol, and other carbon-bearing molecules. The visible channel (covering the spectral range through the visible from 0.250 to 1.0 microns), after a quick glance at its featureless spectrum, was left in the background. However, several instrumental artefacts in the infrared range where giving us a hard time in trying to interpret the observed features: was it noise? Background signal? Calibration residuals? A broad feature at 3.2 um was observed, but we couldn’t be sure of its real nature without independent confirmation.
In the early September, Priscilla Cerroni (a VIRTIS Co-Investigator) was studying the spectra of some carbon-bearing materials used in the past to compare with primitive meteorites (carbonaceous chondrites). These materials, known as “tar” or “kerogen”, contain a large amount of carbon in the form of hydrocarbon aromatic rings as well as short aliphatic bridges and side chains. The spectra Priscilla was analysing, although not showing those distinctive spectral features known as absorption bands representing (when present) the unmistakable signature of some specific molecules or minerals, were still displaying some peculiar shape in the short wavelength region of the spectrum (below 1 micron). In fact, in the neglected VIRTIS visible range the cometary spectrum showed a downturn at about 1.0 micron, which almost exactly matched the one observed in the “tar” laboratory spectra. These analyses gave as the right push to interpret the 3.2um feature as due to the presence of a large fraction of carbon-bearing molecules indicating an organic chemistry on the nucleus of 67P.
A few weeks later, Andrea Raponi (a post-doctoral researcher working at IAPS-INAF), was able to generate an artefacts matrix which effectively removed all the unwanted signal, clearly showing that the 3.2um band was effectively compatible with the presence (as shown recently by Eric Quirico in his Icarus paper) of a semi-volatile component which could be assimilated to carboxylic acids.
This was the first identification of widespread presence of organic material on the surface of a cometary nucleus and this has very important consequences on the understanding of the formation and early evolution of the Solar System.
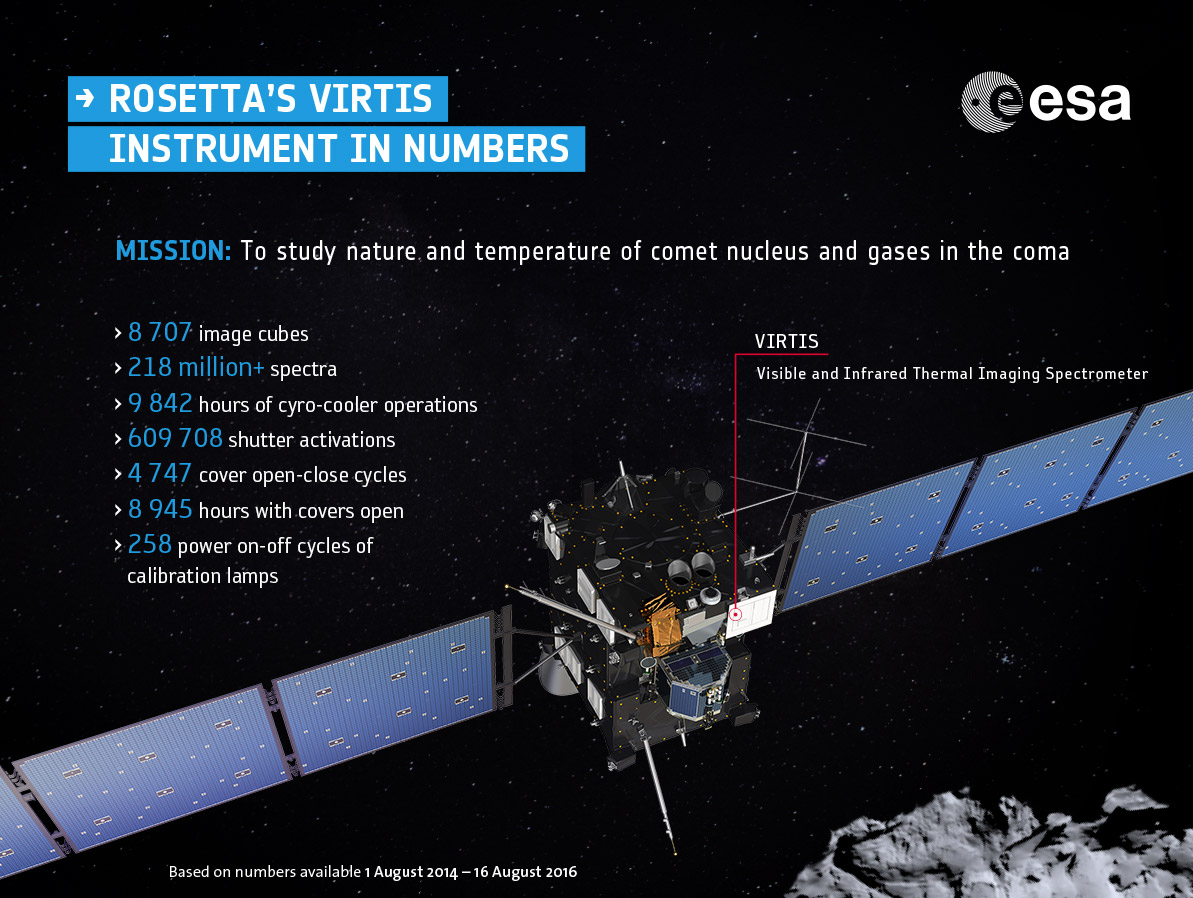
Notes: In most cases, numbers for VIRTIS-M (mapper) visible (VIS) and infrared (IR) channels and VIRTIS-H (high-res) subsystems have been added together. The breakdown is as follows:
VIRTIS-M image cubes: M-VIS: 7054; M-IR: 1653; Spectra: 216 million VR-M spectra (M-VIS: 181,559,400; M-IR: 34,940,200) and 2,395,164 VR-H spectra; Cyro-cooler operations: VR-M: 2535 hours; VR-H: 7307 hours; Shutter activations: VR-M: 35460; VR-H 574248; Cover open-close cycles: VR-M 2085; VR-H 2662; Cover open: VR-M 4100 hours; VR-H 4845 hours; Power on-off cycles of calibration lamps: VR-M: 30; VR-H: 228
The story behind the discovery of the comet’s water cycle was also not straightforward….
We discovered for the first time the presence of abundant organic materials on the surface of the nucleus of a comet, but from where was the abundant water observed by MIRO and ROSINA coming? We had just a hint that in some limited regions water ice could be present mixed in very small quantities with the ubiquitous dark materials. Could it be that all the water ice was kept hidden below the surface?
In late September 2014, while passing along the corridor in front of the office of Maria Cristina De Sanctis (by the way, in those early months almost all the people along that corridor were, and still are, involved in the analysis of the 67P nucleus spectra and most of the time the monitors of their PCs were showing either spectra or false-colour images of the nucleus as obtained by VIRTIS), she told me: “Fabrizio come here a moment, I have something interesting to show you”. Indeed, for the first time, she was able to identify the unmistakable spectral signatures of water ice: these are absorption bands located at 1.05, 1.2, 1.5, 2.0, and 3.0 micron. The most intense of these bands is the 3.0 micron band, which unfortunately is almost superimposed on the 3.2um organic band we had discovered previously. The depth and intensity of an absorption band is proportional to the amount of material producing it, so the combination of paucity of water ice and superposition with another more intense compound was hiding the presence of water ice at the surface. But those were not the only explanations for our failure to identifying water ice earlier: we did not observe it before because not only did we have to observe it in the right place, but also at the right time of day!
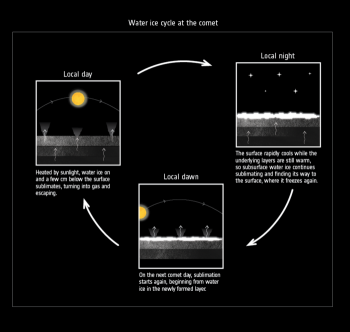
The water-ice cycle of a comet, as inferred by VIRTIS data. Click for full caption and credit.
Cristina showed us several spectra in which the depth of the absorption band (and consequently the amount of water ice present) was decreasing, and guess what? The water ice band decreased as we were moving away from the shadowed regions, creating a direct correlation between surface temperature and water ice abundance: colder areas had more water ice than warmer ones. One could say: “is this a discovery? Where is it more probable to find ice on Earth: at the South Pole or in the Sahara?” This is very true, but a comet is not the Earth; the cometary “atmosphere” is too tenuous to allow recondensation from the coma. We needed a replenishment mechanism to allow ice to form at the surface in the night from an internal source rather than an external one. During a group discussion we came up with the explanation and with the conditions for it to work: the presence of a layered and very insulating surface. In other words, we needed an exterior layer of few millimetres capable of screening the interior from the sudden temperature changes introduced by the shadowing effects of the two lobes and by the more normal day-night variations. On the nucleus there is no atmosphere and the surface directly interacts radiatively with the empty space. An insulating layer when exposed to night conditions cools down very rapidly to below 100K (-173ºC) while the interior is still warm from the previous solar illumination. Ice sublimates from the interior and reaches the surface, which is by now a cold trap, and causes the recondensation of water vapour.
After much discussion with leading science journals, we were eventually able to publish the result, in Nature, nearly a year after the initial discovery.
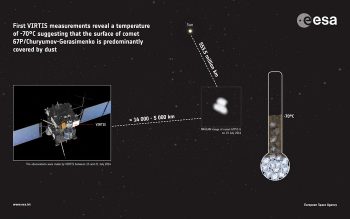
The first temperature measurements by VIRTIS were made on the approach to the comet in July 2014. Click for full caption & credit.
And finally... an update on the comet’s surface temperature
Over the course of the mission VIRTIS measured the rise and fall of the comet’s surface temperature as the comet orbited the Sun. After arriving in August 2014, it was found to range between –93ºC and –43ºC, but by August 2015, when the comet was closest to the Sun, peak measurements reached +54ºC (note: this is not necessarily the highest value on the comet, but certainly the highest recorded by VIRTIS in one particular location in the comet’s southern hemisphere). A year later, they have fallen again to similar values as first measured, as the comet moved away from the Sun again and back towards the outer Solar System.
This and more achieved by an instrument that requires just 60W to operate – as much as a standard light bulb!
---
GROUND STATIONS’ LAST WEEK WITH ROSETTA
As Rosetta counts down to a memorable comet landing and end of mission on 30 September, here’s a brief profile of the three ESA deep-space ground stations that are tracking the spacecraft in its final days. The mission is also being supported by NASA’s Deep Space Network (DSN) and in fact Rosetta will rely on support from the DSN 70 m-diameter dishes in its final days, complementing the support provided by the ESA stations.
Editor’s note: ESA’s three deep-space stations are part of the Agency’s Estrack ground station network, a global system of ground stations providing links between satellites in orbit and ESOC, the European Space Operations Centre, Darmstadt, Germany. The core Estrack network comprises nine stations in seven countries. The essential task of all ESA ground tracking stations is to communicate with spacecraft, transmitting commands and receiving scientific data and spacecraft status information. More information via the Estrack web pages.
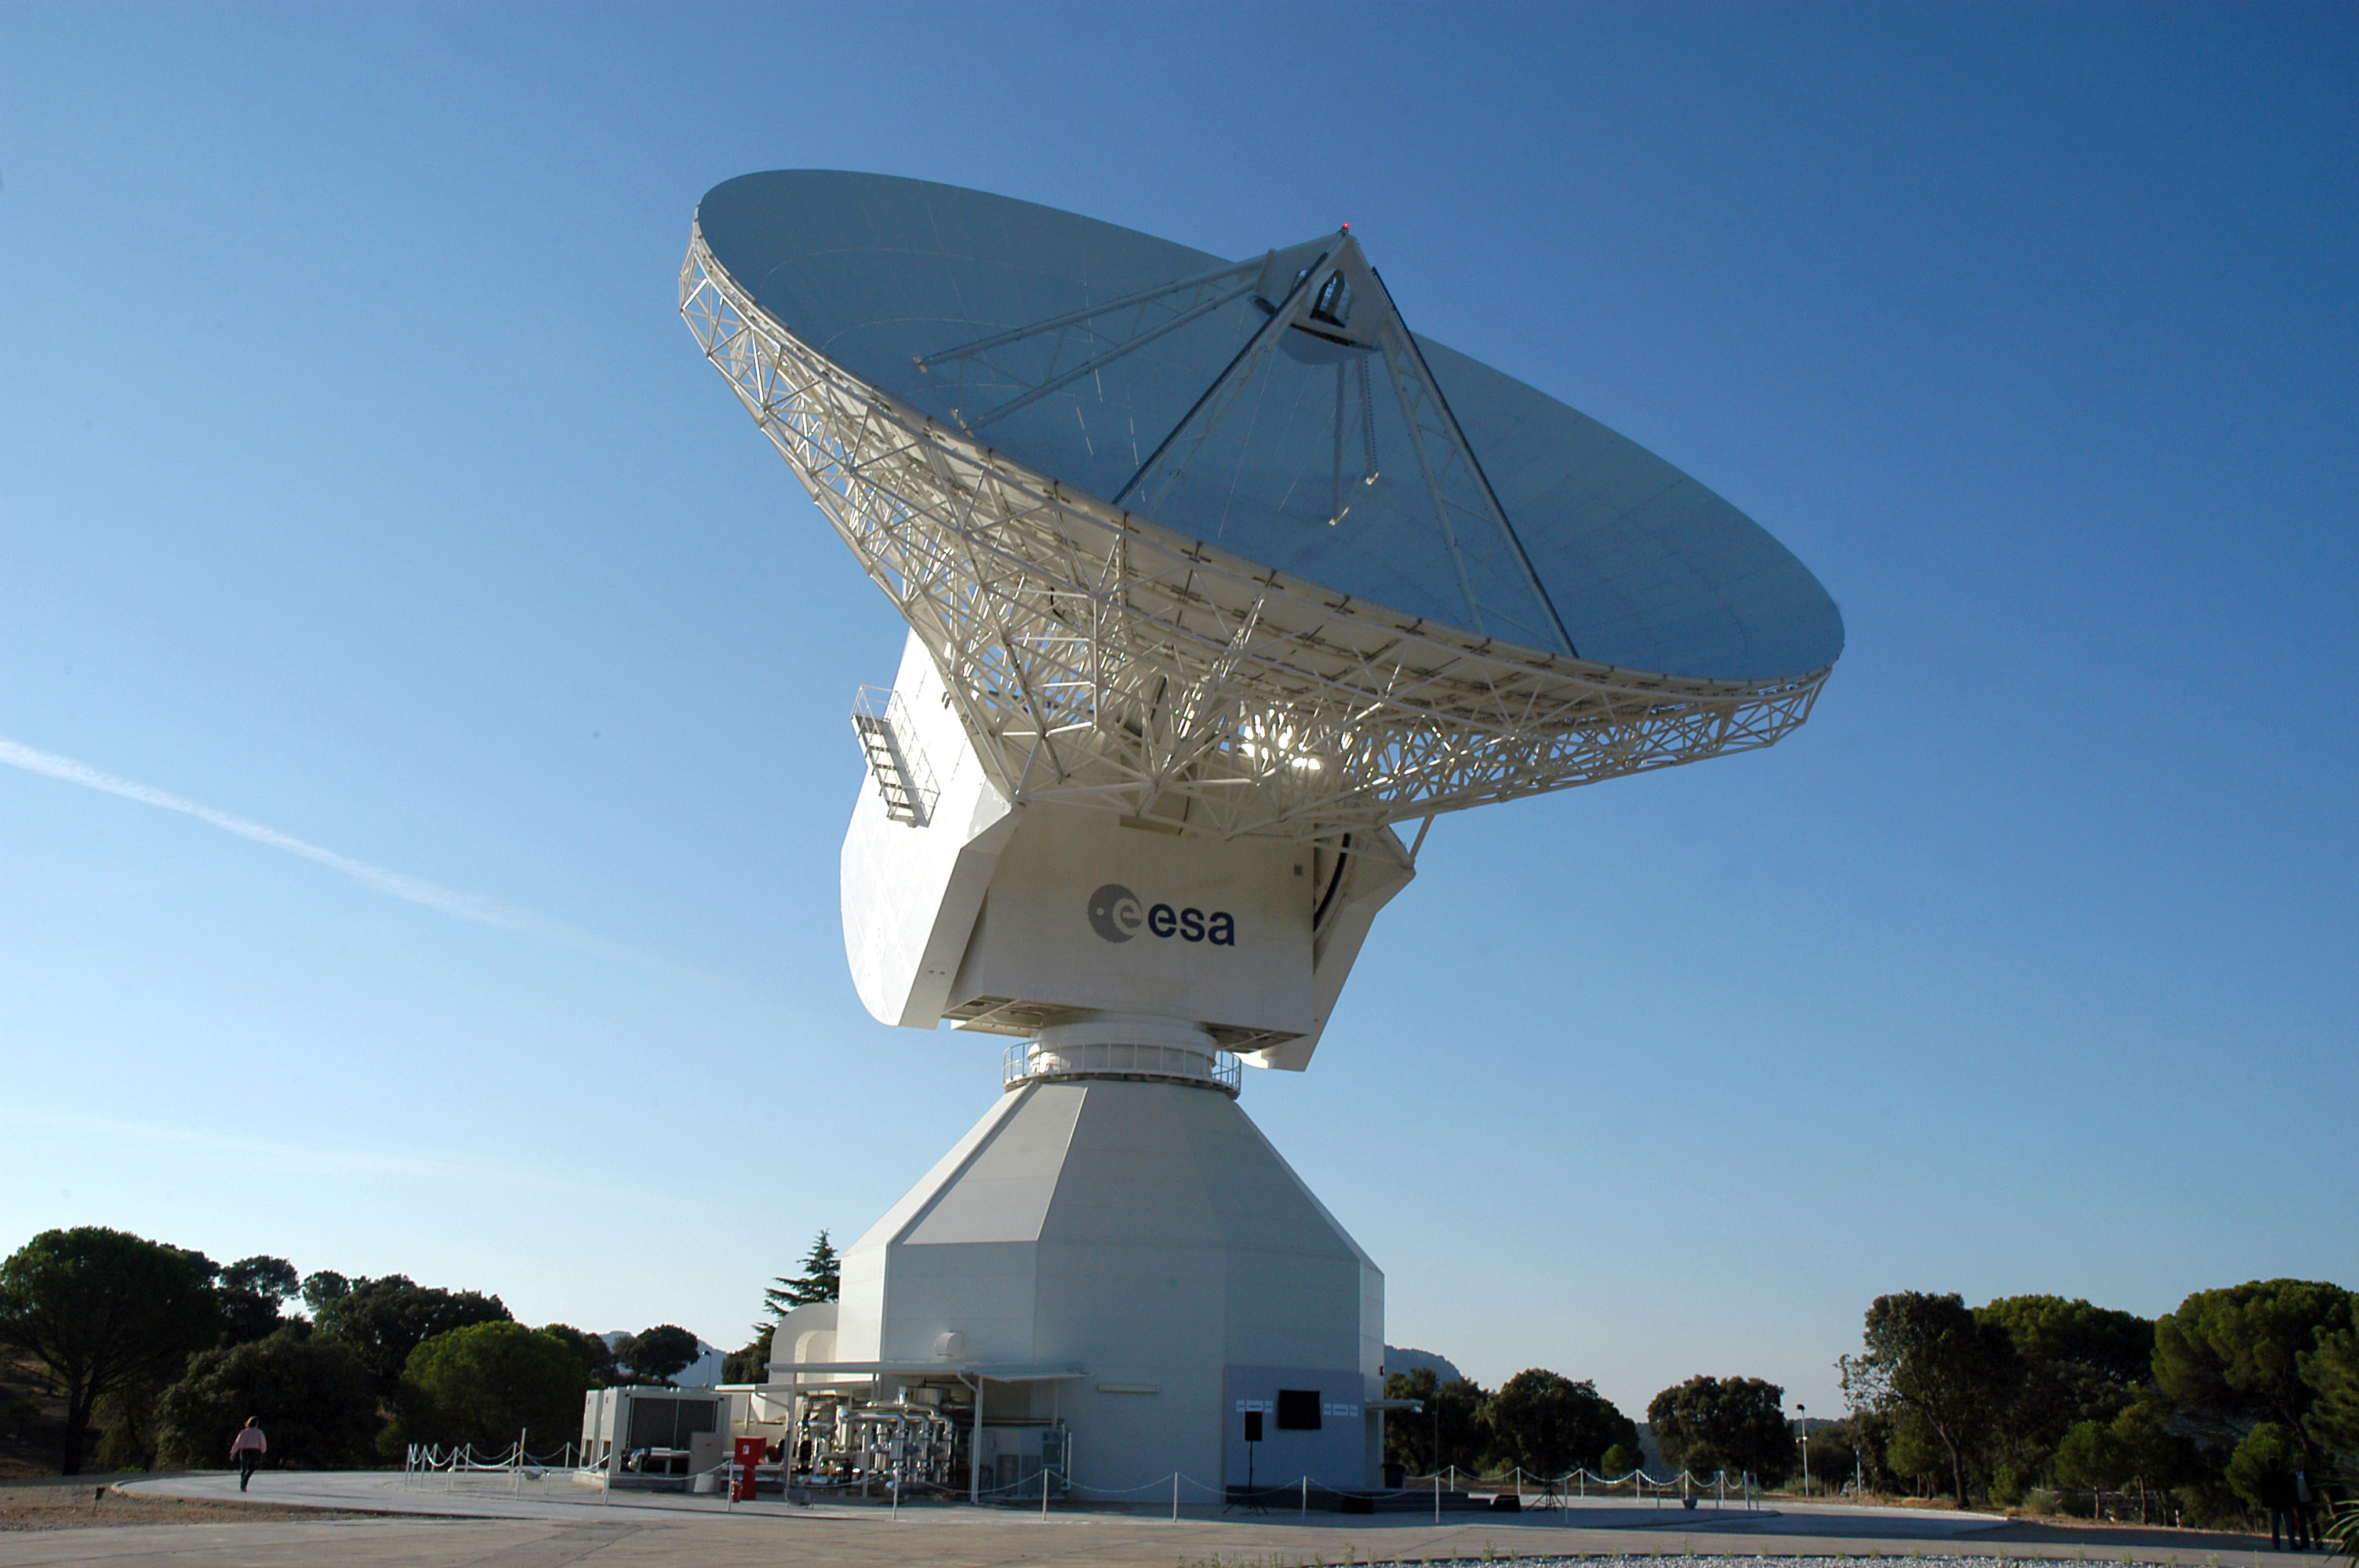
ESA Malargüe station, Argentina
Malargüe station supports many of ESA’s most important exploration missions, including Rosetta, Mars Express, ExoMars, LISA Pathfinder and Gaia. Credit: ESA/D. Pazos
Location: 30 km from Malargüe, Mendoza province, about 1200 km west of Buenos Aires
Dish size: 35m diameter
Moveable structure: 610 tonnes
Entered service: 2013
Routine tracking: Rosetta, Mars Express, ExoMars, Gaia, other solar system missions
Web: http://www.esa.int/mlg
The station conducted its first test tracking in 2012, successfully linking up with ESA’s Mars Express spacecraft at 193 million km from Earth. Since inauguration, it has been a critical component of ESA’s deep-space tracking capability. Joining the existing ESA 35m stations in Australia and Spain, it ‘closed the gap’, ensuring 360° coverage for the growing fleet of ESA and partner missions exploring our Solar System.
It features Low Noise Amplifiers cooled to 15 degrees Kelvin (-258 Celsius) that enable the receipt of ultra-weak signals from deep space, while atomic clocks are used for very precise radiometric measurements, needed to accurately locate and guide space probes.
For the Rosetta mission, Malargüe station has provided routine tracking support, including transmitting telecommands to Rosetta and the Philae lander, and receiving critical spacecraft status and health information and the precious scientific data gathered by the instruments.
Last call: In the six days ending 30 September, Malargüe station will have communicated with Rosetta five times, with the final pre-landing contact set for mid-day Wednesday.
Interesting to note: The station is located in Mendoza province, a region of Argentina famous worldwide for the wine produced in its dry, sunny climate. The location of the 1972 Andes flight disaster, dramatised in the 1993 film Alive: The Miracle of the Andes, is just 138 km, as the crow flies, from ESA’s station.
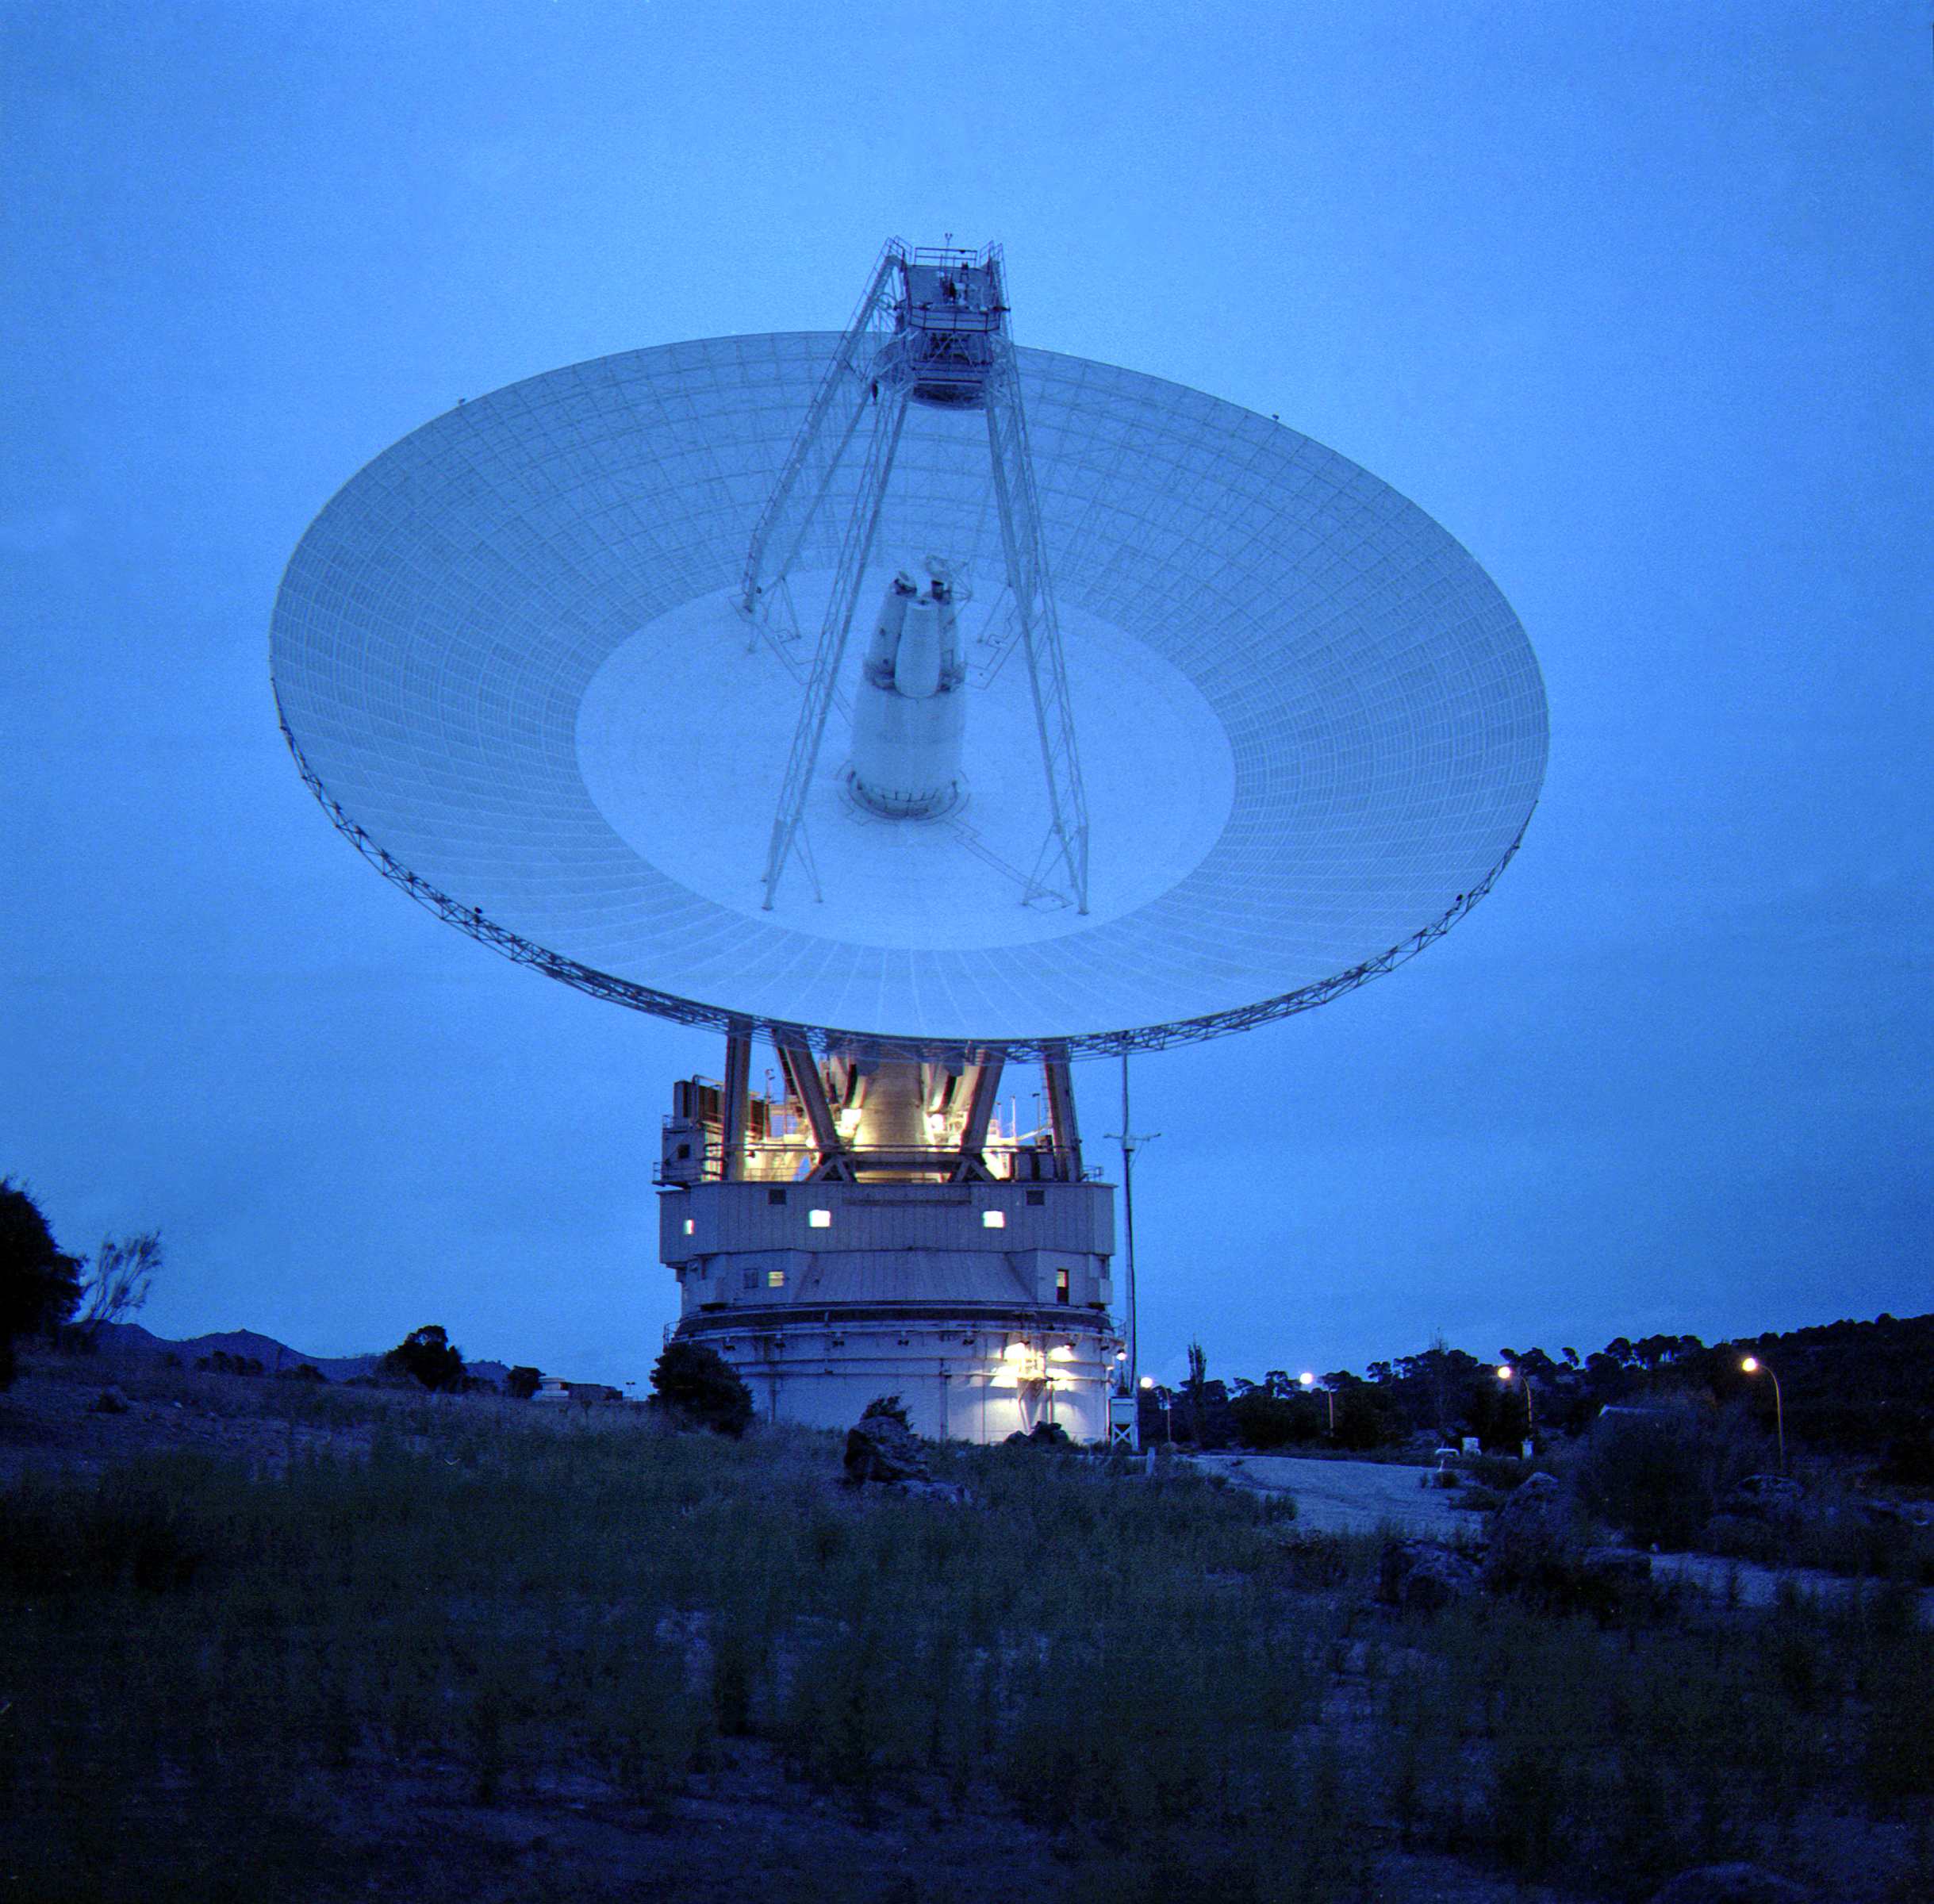
ESA Cebreros station, Spain
ESA's 35 m-diameter deep-space dish antenna, DSA-2, is located at Cebreros, near Avila, Spain. It is controlled, as part of the Estrack network, from ESOC, the European Space Operations Centre, Darmstadt, Germany. Credit: ESA
Location: 12 kms south of Cebreros town, Avila province; West of Madrid
Dish size: 35m diameter
Moveable structure: 610 tonnes
Entered service: 2005
Routine tracking: Rosetta, Mars Express, ExoMars, Gaia, other solar system missions
Web site: http://www.esa.int/ceb
Construction on the Cebreros station started in early 2004 and the station was formally inaugurated in September 2005. The first signal was received from Venus Express on 10 November 2005, marking the start of operations. Since then, it has supported a wide range of ESA and partner agency missions, including the landing of NASA’s Mars Science Laboratory (MSL) in 2012.
Like ESA’s Malargüe and New Norcia stations, Cebreros incorporates state-of-the-art technology including a control system providing the highest possible pointing accuracy under the site's environmental, wind and temperature conditions.
For the Rosetta mission, Cebreros station has provided routine tracking support, including transmitting telecommands to Rosetta and the Philae lander, and receiving critical spacecraft status and health information and the precious scientific data gathered by the instruments.
Last call: Cebreros station made its last planned link-up with Rosetta on Monday, 26 September. It will serve as a ‘hot back-up’ during the crucial comet landing phase on 30 September.
Interesting to note: ESA’s Cebreros station was built on the site of a former NASA tracking station (DSS 62) closed in 1981.
ESA New Norcia station, Australia
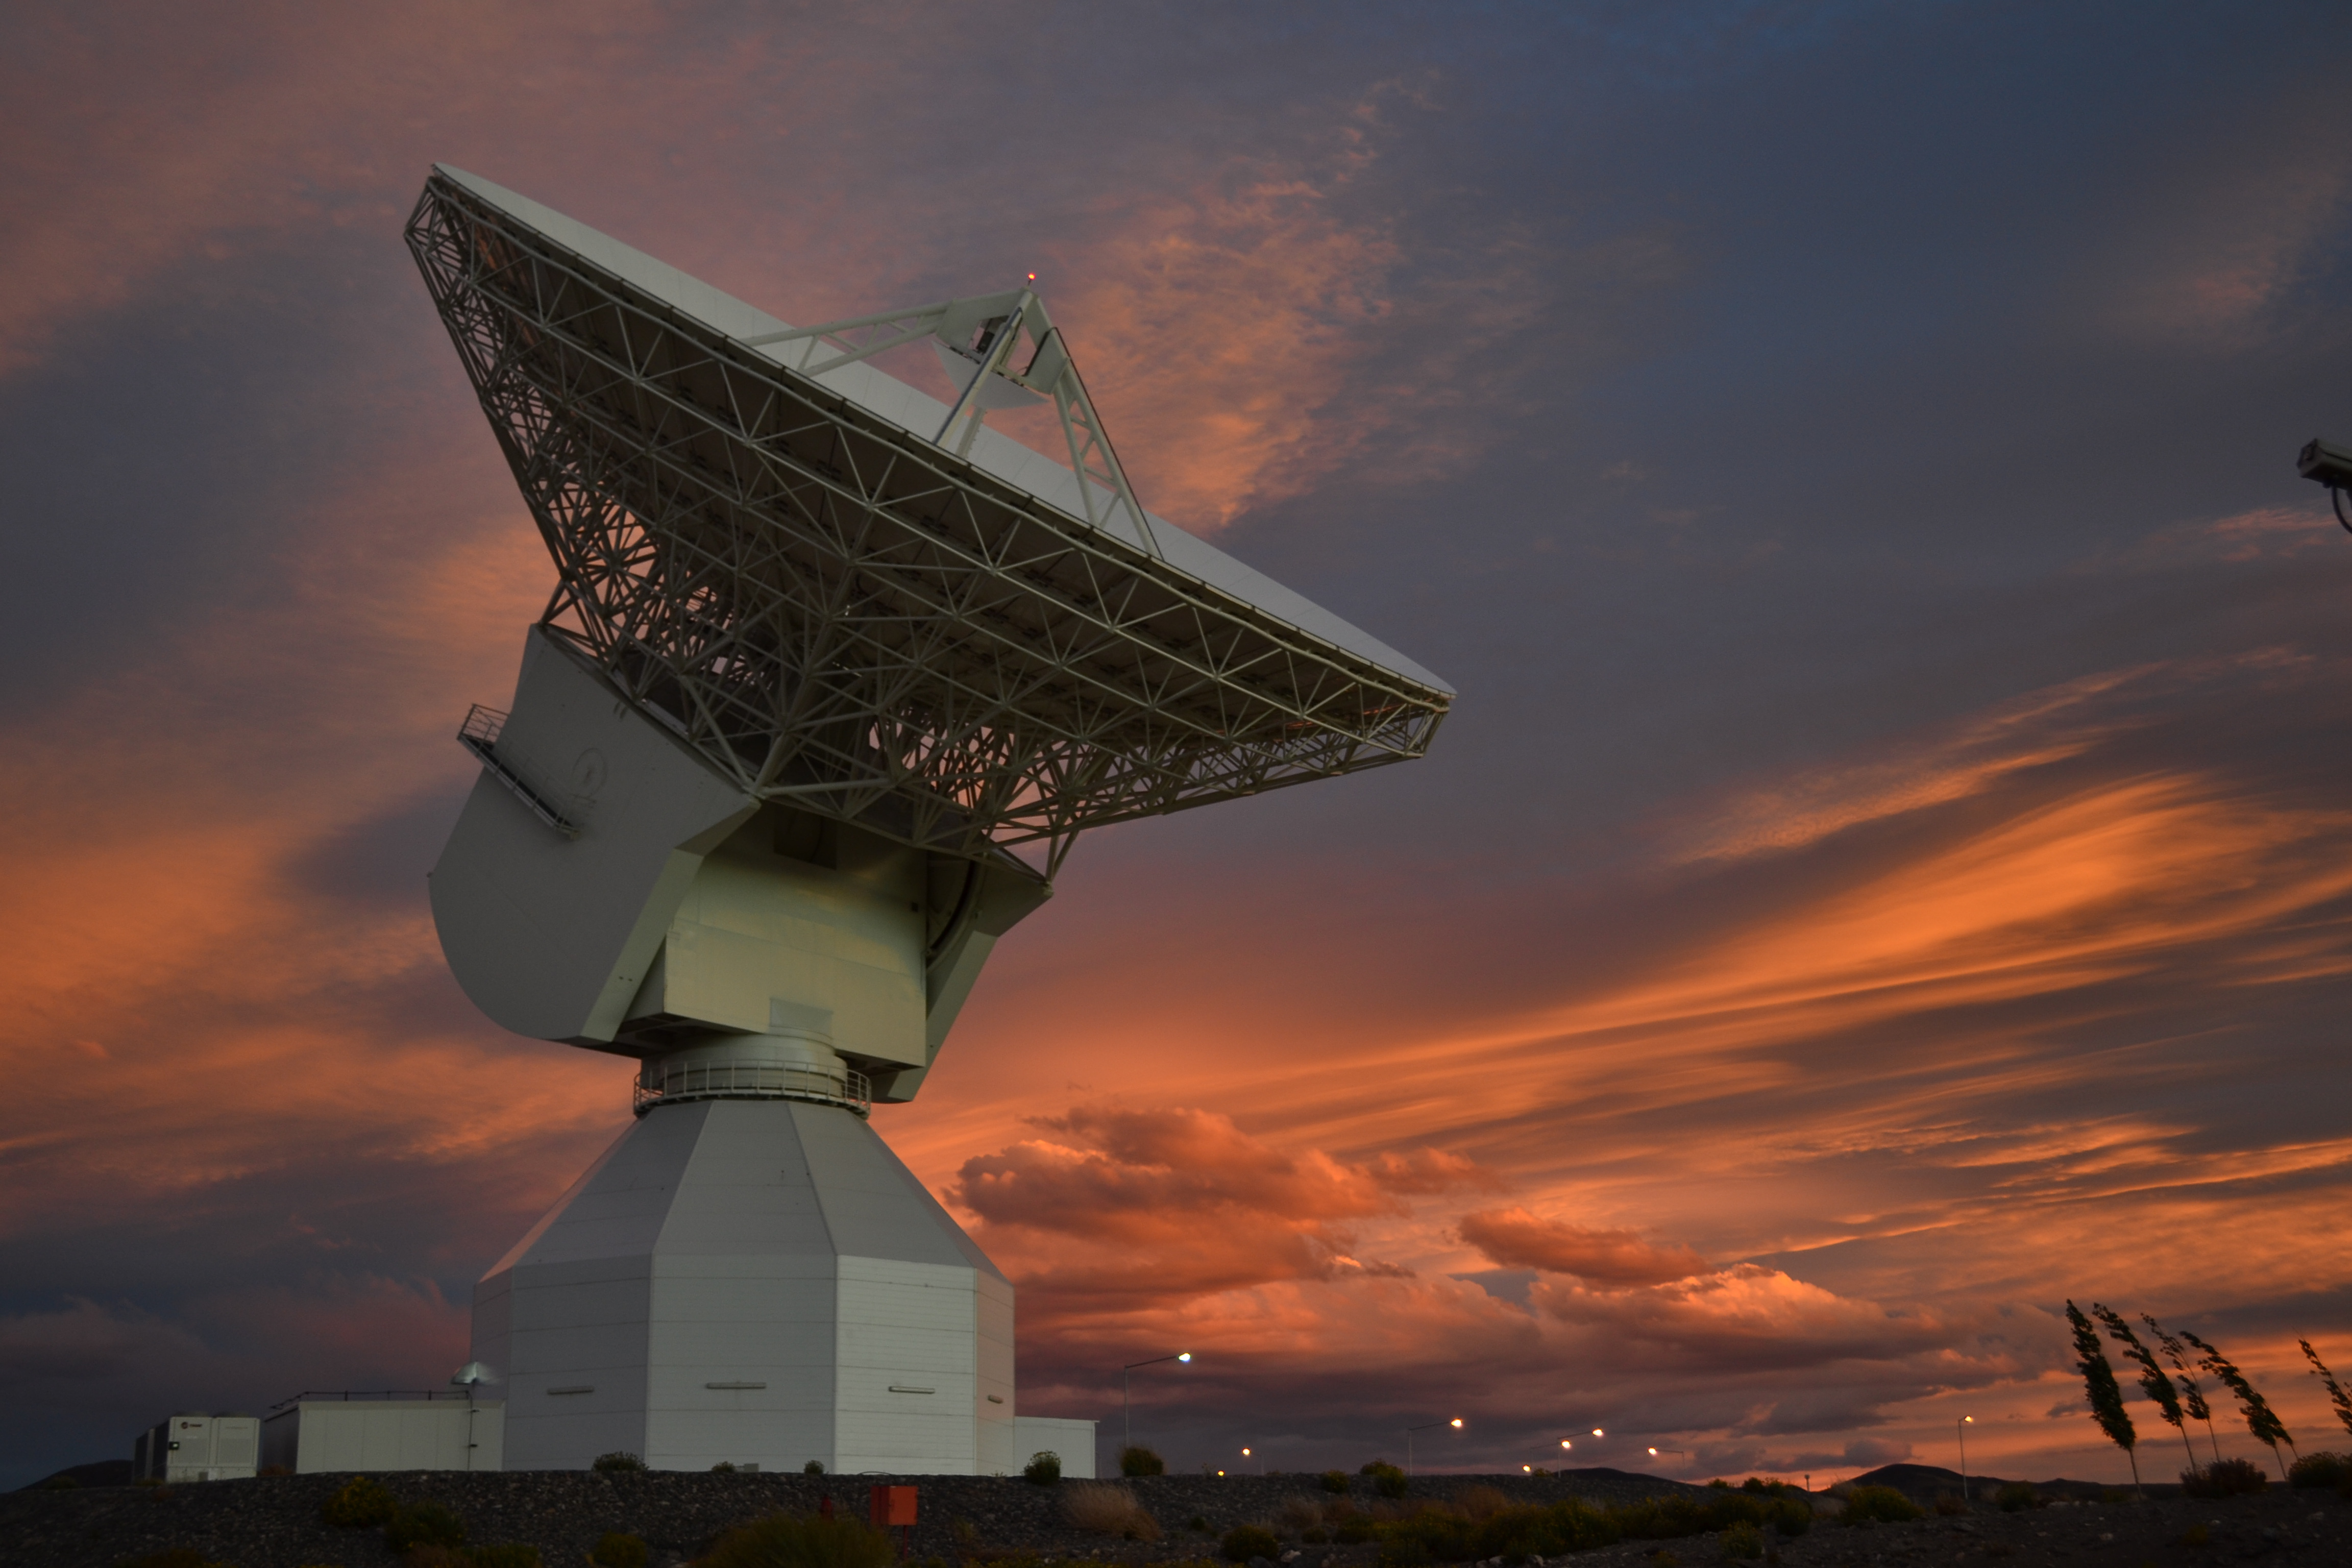
ESA's 35 m-diameter deep-space tracking station at New Norcia, Australia, seen during a dramatic sunset, 11 November 2014. Credit: ESA
Location: 8 km south of New Norcia, which is about 150 km north of Perth, Western Australia
Dish size: 35m diameter
Moveable structure: 610 tonnes
Entered service: 2003
Routine tracking: Rosetta, Mars Express, ExoMars, Gaia, other solar system missions
Webpage: http://www.esa.int/nno
Construction of ESA’s first deep-space tracking station began in 2002, in part driven by the need to provide reliable deep-space communications with the Rosetta comet chaser, set for launch in 2004. Indeed, New Norcia has served as the primary station for the mission, providing extended support throughout Rosetta’s cruise phase, planetary flybys, asteroid encounters and, finally, the arrival at, landing on and orbiting of comet 67P/C-G.
Like ESA’s Malargüe and Cebreros stations, New Norcia is remote controlled for routine operations from ESA’s ESOC mission control centre in Darmstadt, Germany. All three stations are equipped with equipment and technology to support radio science, enabling scientists to analyse received signals to study planetary atmospheres.
For the Rosetta mission, New Norcia station has served as prime ground station and provided routine tracking support, including transmitting telecommands to Rosetta and the Philae lander, and receiving critical spacecraft status and health information and the precious scientific data gathered by the instruments.
Last call: In the six days ending 30 September, New Norcia station will have communicated with Rosetta four times, with the final pre-landing contact set for early-day Wednesday. It will serve as a ‘hot back-up’ during the crucial comet landing phase on 30 September.
Interesting to note: The town of New Norcia, Western Australia, is Australia’s only monastic town. The Benedictine community was established in 1847. In August 2016, New Norcia station acquired signals from the international Cassini spacecraft orbiting Saturn, across more than 1.4 billion km of space – the longest link ever made by an ESA station.
NASA Deep Space Network support to Rosetta end of mission
NASA’s DSN network has provided continuing, routine support to the Rosetta mission since the start of the mission (see “Tracking the spacecraft following a comet”).
DSN MDSCC site, Robledo de Chavala, Madrid, Spain Credit: NASA
Numerous DSN stations – including the three, giant 70m antennas located at Madrid, Spain, Canberra, Australia, and Goldstone, California, have provided robust support throughout the mission, providing indispensable communication support when ESA’s smaller stations alone would have been challenged to establish links due to the distances involved.
DSN stations have also provided prime or back-up links during critical mission phases, when commands absolutely had to be transmitted without delay or interruption or in case of any failure at a prime station.
DSN support was especially critical in 2014 when Rosetta woke up from 31 months of hibernation in January, during arrival in August that year and during Philae’s historic landing the following November.
Outside critical phases, DSN stations have augmented coverage, helping to increase science return.
For the end of mission, DSN support will again be crucial.
In the final week leading up to 30 September, one of NASA’s 34m stations (DSS 25) and the three 70m stations (DSS 14 at Goldstone, DSS 43 at Canberra and DSS 63 at Madrid) are providing prime or back-up links to the spacecraft.
The last command instructions will be sent up from the flight control team early in the morning of 30 September via DSS 43 at Canberra or DSS 63 in Madrid.
Once Rosetta has commenced its ‘big dive’ – its final descent to the surface of comet 67P/C-G – prime communication will be provided by DSN Madrid, with hot backups provided by ESA Cebreros and Malargüe stations.
Data received by the DSN antenna – including the extremely important final science data from most of the instruments including the OSIRIS imaging system – will be immediately passed to ESA’s mission control centre at ESOC, Darmstadt, Germany. Science teams will be working there to receive, process and share the last images, amongst other ‘final science.’
---
SCIENCE ‘TIL THE VERY END
Rosetta will collect science data until the very end of its descent on Friday. The opportunity to study a comet at such close proximity makes the descent phase one of the most exciting of the entire mission.
A summary of the goals of the instruments that are operating during the descent are provided below:
Artist's impression of Rosetta descending to the surface of Comet 67P/Churyumov–Gerasimenko on 30 September 2016. Credits: ESA/ATG medialab
OSIRIS
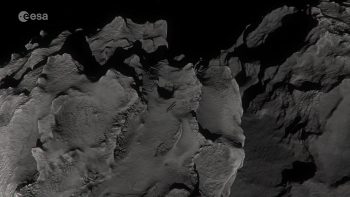
During the descent to the small comet lobe from an initial starting point of an altitude of around 19 km, the OSIRIS cameras (both narrow- and wide-angle) will first image the regions of the large lobe that it passes over. As the spacecraft approaches the small lobe, the cameras will target the walls of the Ma’at pits. The very high resolution data of these features will provide important information for our understanding of how activity is driven on the comet and maybe how the comet was formed in the first place.
In order to downlink the highest possible number of images in the limited time available before the spacecraft impacts the surface, especially in the final stages of the descent, the images will be highly compressed, up to 20 times compared with ‘normal’ images. On top of compressing, the images will also be downsized, such that instead of a handful of full-frame 2048 x 2048 pixel images, we will be able to receive many more smaller images in the region of 1000 x 1000 pixels down to 480 x 480 pixels.
It is also important to remember that the cameras were not designed to image the comet from this close proximity: NAC becomes out of focus from an altitude of around 1 km and less, and WAC from below 200-300 m. Below 200-300m the images will be increasingly blurred and thus not as ‘crisp’ as we have been accustomed to.
Select OSIRIS images from the descent will be presented by the instrument Principal Investigator, Holger Sierks, at various points during our live broadcast, and published in parallel on our ESA channels. This is expected to include the very last image downloaded from the spacecraft, anticipated to be available within about 10 minutes of the confirmation of end of mission.
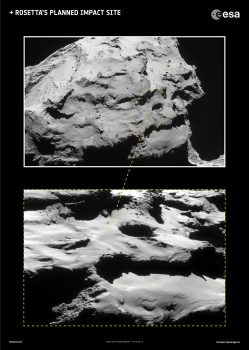
Rosetta's planned impact site, within a ~700 x 500 m ellipse. Click for high res and full caption and credit info.
ROSINA will collect unique data on the density of gas around the comet and its composition. It is expected to provide readings down to the Knudsen Layer, where the sublimation of the gases actually happens.
MIRO will complement OSIRIS and ROSINA measurements by measuring the surface temperature.
GIADA will measure the dust density and the way the dust grains are accelerated away from the comet.
RPC’s instrument suite will monitor the plasma environment, and also the smallest dust particles. This will give a unique close-up look at the interaction between the solar wind and the surface of the comet, and it will sample levitating charged grains.
Alice will get its highest resolution ultraviolet spectra of the surface of the whole mission and provide complementary measurements to some of the RPC data.
RSI will get the most accurate measurements of the gravity field during descent.
Navigation Camera
The spacecraft’s Navigation Camera will also play a role in the final sequence of data collected, albeit very early in the descent. Shortly after the spacecraft has been set on a collision course for the comet, the NAVCAM will take five images. These are due to be downloaded in the early hours of 30 September, and will be used by the flight team to predict the impact time to within a four-minute window.
How much data?
Many of the science instruments are expected to return their last data from between 20 m and 5 m above the surface.
The bit rate for the Madrid Deep Space Network ground station during the descent is 45760 bps and the expected data downlinked between the end of the collision manoeuvre on 29 September and impact on 30 September is 1558 Mbits (which equates to 195 MB of science and instrument-related house-keeping data).
The break-down per instrument is expected as follows:
Alice: 37 Mbit
GIADA: 3 Mbit
MIRO: 6 Mbits
NAVCAM: 64 Mbit
OSIRIS: 1177 Mbits
ROSINA: 49 Mbits
RPC: 128 Mbit
Instrument House Keeping: 93 Mbit
Why are not all instruments operating?
Because Rosetta is so far from the Sun now it cannot generate enough power from its solar panels to keep everything running, so not all instruments will be able to operate in the final phase of the mission. Indeed, after careful consideration, balancing science operations constraints – some instruments require quite some time to obtain their measurements – and the potential science return, the timeline prepared by the science operations team at ESAC, with the Rosetta Science Working Team, sees MIDAS, COSIMA and VIRTIS turned off. The SREM will also be off.
After Rosetta has touched down, it will not be possible to collect or return any additional data. The unique measurements obtained during this final descent will be a fitting closing chapter to Rosetta’s time spent living with this comet.
Quelle: ESA