
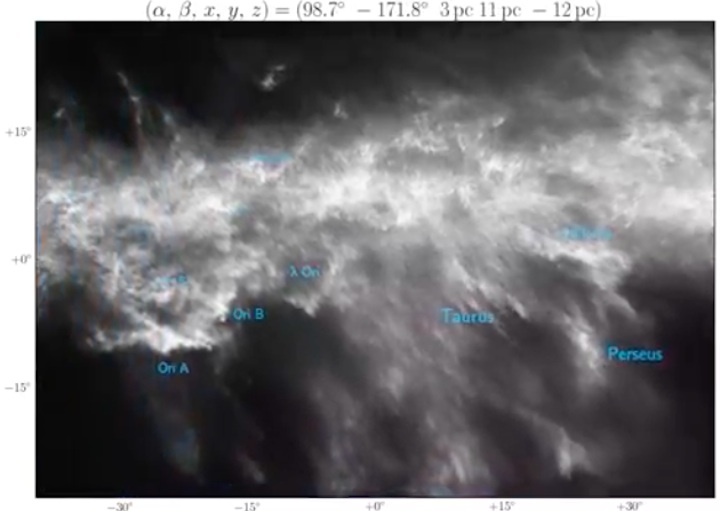
This animation shows a 3-D rendering of space dust, as viewed in a several-kiloparsec (thousands of light years) loop through and out of the Milky Way’s galactic plane. The animation uses data for hundreds of millions of stars from Pan-STARRS1 and 2MASS surveys, and is made available through a Creative Commons License. (Credit: Gregory M. Green/SLAC, KIPAC)
Consider that the Earth is just a giant cosmic dust bunny—a big bundle of debris amassed from exploded stars. We Earthlings are essentially just little clumps of stardust, too, albeit with very complex chemistry.
And because outer space is a very dusty place, that makes things very difficult for astronomers and astrophysicists who are trying to peer farther across the universe or deep into the center of our own galaxy to learn more about their structure, formation and evolution.
Building a better dust map
Now, a new study led by Edward F. Schlafly, a Hubble Fellow in the Physics Division at the Department of Energy’s Lawrence Berkeley National Laboratory (Berkeley Lab), is providing a detailed, 3-D look at dust on a scale spanning thousands of light-years in our Milky Way galaxy. The study was published today in The Astrophysical Journal.
This dust map is of critical importance for the Dark Energy Spectroscopic Instrument (DESI), a Berkeley Lab-led project that will measure the universe’s accelerating expansion rate when it starts up in 2019. DESI will build a map of more than 30 million distant galaxies, but that map will be distorted if this dust is ignored.
“The light from those distant galaxies travels for billions of years before we see it,” according to Schlafly, “but in the last thousand years of its journey toward us a few percent of that light is absorbed and scattered by dust in our own galaxy. We need to correct for that.”
Just as airborne dust in Earth’s sky contributes to the atmospheric haze that gives us brilliant oranges and reds in sunrises and sunsets, dust can also make distant galaxies and other space objects appear redder in the sky, distorting their distance and in some cases concealing them from view.
Scientists are constantly developing better ways to map out this interstellar dust and understand its concentration, composition, and common particle sizes and shapes.

The dark regions show very dense dust clouds. The red stars tend to be reddened by dust, while the blue stars are in front of the dust clouds. These images are part of a survey of the southern galactic plane. (Credit: Legacy Survey/NOAO, AURA, NSF)
Once we can solve the dust problem by creating better dust maps and learning new details about the properties of this space dust, this can give us a much more precise gauge of distances to faraway stars in the Milky Way, like a galactic GPS. Dust maps can also help to better gauge the distance to supernovae events by taking into account the effects of dust in reddening their light.
“The overarching aim of this project is to map dust in three dimensions—to find out how much dust is in any 3-D region in the sky and in the Milky Way galaxy,” Schlafly said.
Combined data from sky surveys shed new light on dust
Taking data from separate sky surveys conducted with telescopes on Maui and in New Mexico, Schlafly’s research team composed maps that compare dust within one kiloparsec, or 3,262 light-years, in the outer Milky Way—including collections of gas and dust known as molecular clouds that can contain dense star- and planet-forming regions known as nebulae—with more distant dust in the galaxy.

Pan-STARRS2 and PanSTARS1 telescopes atop Haleakalā on the island of Maui, Hawaii. (Credit: Pan-STARRS)
“The resolution of these 3-D dust maps is many times better than anything that previously existed,” said Schlafly.
This undertaking was made possible by the combination of a very detailed multiyear survey known as Pan-STARRS that is powered by a 1.4-gigapixel digital camera and covers three-fourths of the visible sky, and a separate survey called APOGEE that used a technique known as infrared spectroscopy.

A compressed view of the entire sky visible from Hawaii by the Pan-STARRS1 Observatory. The image is a compilation of half a million exposures, each about 45 seconds in length, taken over a period of four years. The disk of the Milky Way looks like a yellow arc, and the dust lanes show up as reddish-brown filaments. The background is made up of billions of faint stars and galaxies. (Credit: D. Farrow/Pan-STARRS1 Science Consortium, and Max Planck Institute for Extraterrestrial Physics)
Infrared measurements can effectively cut through the dust that obscures many other types of observations and provides a more precise measurement of stars’ natural color. The APOGEE experiment focused on the light from about 100,000 red giant stars across the Milky Way, including those in its central halo.

The Sloan Digital Sky Survey telescope used by APOGEE. (Credit: SDSS)
What they found is a more complex picture of dust than earlier research and models had suggested. The dust properties within 1 kiloparsec of the sun, which scientists measure with a light-obscuring property known as its “extinction curve,” is different than that of the dust properties in the more remote galactic plane and outer galaxy.
New questions emerge on the makeup of space dust
The results, researchers found, appear to be in conflict with models that expect dust to be more predictably distributed, and to simply exhibit larger grain sizes in areas where more dust resides. But the observations find that the dust properties vary little with the amount of dust, so the models may need to be adjusted to account for a different chemical makeup, for example.
“In denser regions, it was thought that dust grains will conglomerate, so you have more big grains and fewer small grains,” Schlafly said. But the observations show that dense dust clouds look much the same as less concentrated dust clouds, so that variations in dust properties are not just a product of dust density: “whatever is driving this is not just conglomeration in these regions.”
He added, “The message to me that we don’t yet know what’s going on. I don’t think the existing (models) are correct, or they are only right at the very highest densities.”
Accurate measures of the chemical makeup of space dust are important, Schlafly said. “A large amount of chemistry takes place on dust grains, and you can only form molecular hydrogen on the surface of dust grains,” he said—this molecular hydrogen is essential in the formation of stars and planets.
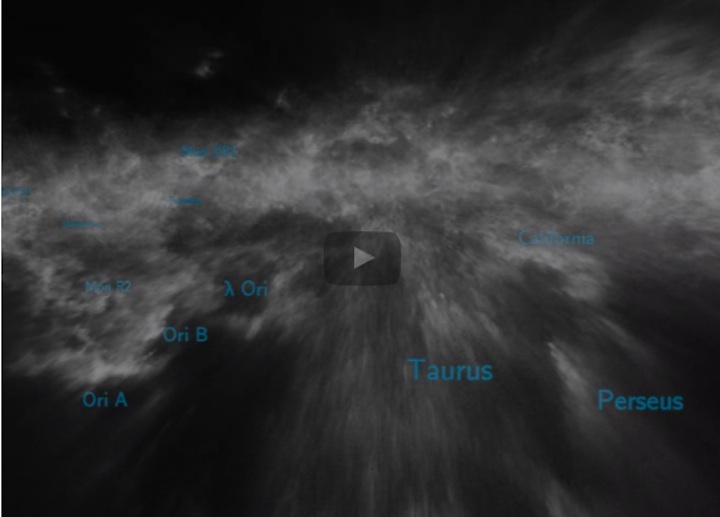
This animation shows a 3-D rendering of dust, as viewed from a 50-parsec (163-light-year) loop around the sun. The animation uses data for hundreds of millions of stars from Pan-STARRS1 and 2MASS surveys, and is made available through a Creative Commons License: https://creativecommons.org/licenses/by-sa/4.0/. (Credit: Gregory M. Green/SLAC, KIPAC)
Filling in the blanks

A graphic view of the Milky Way, with the sun’s position circled in red. Our solar system is in a region called the Orion Spur. (Credit: NASA/Adler/U. Chicago/Wesleyan/JPL-Caltech)
Even with a growing collection of dust data, we still have an incomplete dust map of our galaxy. “There is about one-third of the galaxy that’s missing,” Schlafly said, “and we’re working right now on imaging this ‘missing third’ of the galaxy.” A sky survey that will complete the imaging of the southern galactic plane and provide this missing data should wrap up in May, he said.
APOGEE-2, a follow-up survey to APOGEE, for example, will provide more complete maps of the dust in the local galaxy, and other instruments are expected to provide better dust maps for nearby galaxies, too.
While the density of dust shrouds our view of the center of the Milky Way, Schlafly said there will be progress, too, in seeing deeper and collecting better dust measurements there as well.
Researchers at the Harvard-Smithsonian Center for Astrophysics and Harvard University also participated in this work.

The planned APOGEE-2 survey area overlain on an image of the Milky Way. Each dot shows a position where APOGEE-2 will obtain stellar spectra. (Credit: APOGEE-2)
APOGEE is a part of the Sloan Digital Sky Survey III (SDSS-III), with participating institutions including Berkeley Lab, the Alfred P. Sloan Foundation, and the National Science Foundation. PanSTARRS1 surveys are supported by the University of Hawaii Institute for Astronomy; the Pan-STARRS Project Office; the Max-Planck Society and its participating institutes in Germany; the Johns Hopkins University; the University of Durham, the University of Edinburgh, and the Queen’s University Belfast in the U.K.; the Harvard-Smithsonian Center for Astrophysics; the Las Cumbres Observatory Global Telescope Network Inc.; and the National Central University of Taiwan. Pan-STARRS is supported by the U.S. Air Force.
Quelle: Lawrence Berkeley National Laboratory