
.
In August, a group, called “The Scientific Coalition for UFOlogy” (SCU), released an extensive report regarding an Infrared video of a UFO that was taken by a Department of Homeland Security tracking plane orbiting an airport in Puerto Rico. The report, and its conclusion, was then promoted heavily by several blogs as something extraordinary that deserved scientific attention.
According to the SCU’s report, the UAP was flying at high speed against the wind and then submerged into the ocean without changing its speed significantly. To the authors of this report, this event was one of those classic UFO cases that could never be ex- plained by something conventional. Because the name of the group used the word “scientific”, it implied those studying the video were actual scientists and gave the conclusions credibility. However, examination of the report and video demonstrated that some of the conclusions reached by these individuals were wrong and not very scientific.
The SCU report
The SCU states that they are “scientifically studying UFOs, USOs, and UAPs”. 1 Some of the members of SCU are also part of MU- FON, which makes me wonder why they had to form a separate group to investigate the case. After all, isn’t MUFON supposed to be “scientifically studying UFOs” as well?
The report is an extensive item that is full of a lot of calculations that the average reader can quickly be overwhelmed by. After burying the reader with a lot of information, they concluded that this was some form of exotic craft:
This video is the best documentation of an unknown aerial and submerged nautical object exhibiting advanced technology that the authors of this report have seen.2
This statement is rather strong wording and indicates they have conducted an exhaustive study that can not be debunked. Because of the reports length it took some time to digest the main arguments. Fortunately, I had some help from some associates I worked with in the past.
Once again, several UFO proponents and skeptics met together on Face book to take a look at this report. The group became known as the “Puerto Rico Research Review” (PRRR).3 It included some newer members that presented an even more diverse col- lective than the RSRG. It did not take long for the team to note that some of the claims made by the report were not supported by the evidence. Isaac Koi took the liberty to create a web site, which contains a wealth of data and information (including how to read the video display indications) for anybody wanting to access information about the case without having to wade through the report for details.
Instrument accuracy
Looking at the data in the video display, there were several items I noticed that would affect any measurements performed from this information:
1. The digital readout displays the position of the aircraft but that position is only precise to the nearest second of arc. That means the position of the aircraft is only reliable to within about fifty feet.
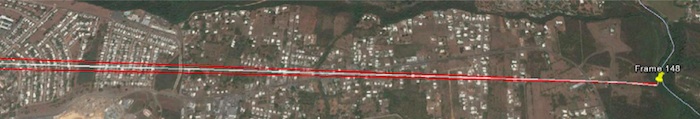
2. The true azimuth indication for the center of the frame only reads out to the nearest degree. That means the azimuth bearing can be that value +/-0.5 degrees. At the distances involved, an error of 0.5 degree can shift the position of the target signifi- cantly as the distance to the target increases. One can see this in the image below, where the azimuth (white) is flanked by two red lines indicating the +/- 0.5 degree error range.
.
3. There are several instances in the video that show locations of known targets where we can check to see how reliable the data being displayed was. There is one example of the water tower on the north side of the airport. According to Google earth, it is located at 18°29’46.17”N 67° 8’38.96”W.4 The camera pans at the water tower in frame 332.5 The following table gives us the position of the plane, the azimuth provided by the instrument, and the cross-hair target lo- cation. Compare this when using the position of the plane, the water tower, and the azimuth using “the great circle calculator” tool and Google Earth:
.
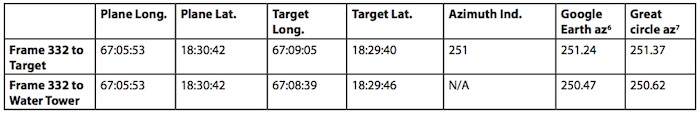
These values indicate that the azimuth indication can be off by a half-degree or, possibly, more. The SCU team mentions the resolution error in their paper. They state that the error for the target location is lagging behind by about a second, which they incorporated in all of their measurements.8 However, they never show how it was incorporated/determined. If their assessment is true, the location for the water tower should be correct in frame 362.9
.
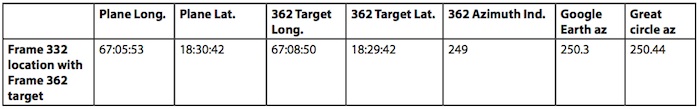

While these values are an improvement, it is not quite the precise measurement that the SCU report implies. Comparing the true azimuth from the plane to the tower in frame 332 to the target values found in frame 362 improves the precision to about 1/5th of a degree.
These issues are important factors to consider when attempting to determine locations of the target and drawing any conclusions.
Is it a balloon?
Viktor Golubic had been debating this case on the UFO updates Face book page for some time before the release of the SCU
10
report. He had concluded it was nothing more than a balloon. While Viktor had his strong opinion on this, he did not present
any report so others could examine his conclusions and how he arrived at them.
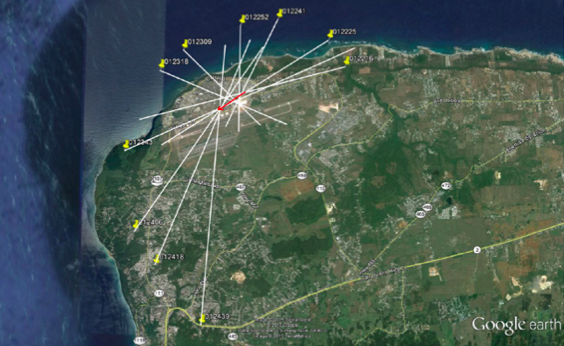
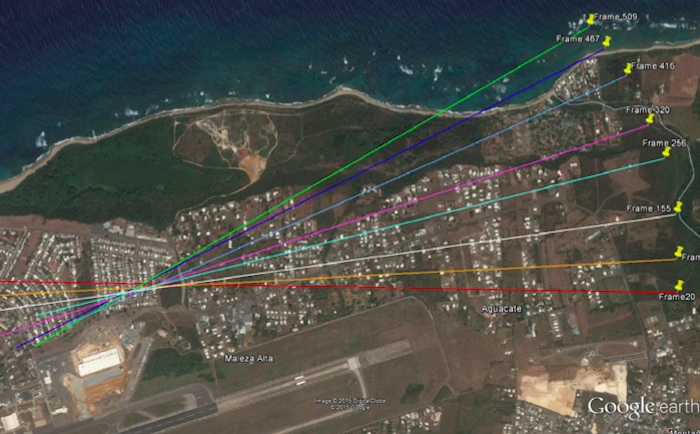
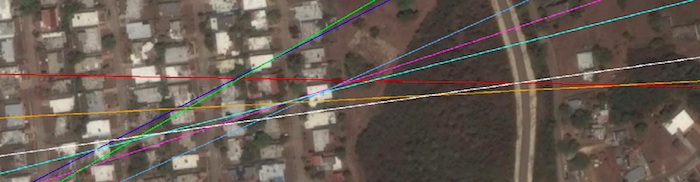
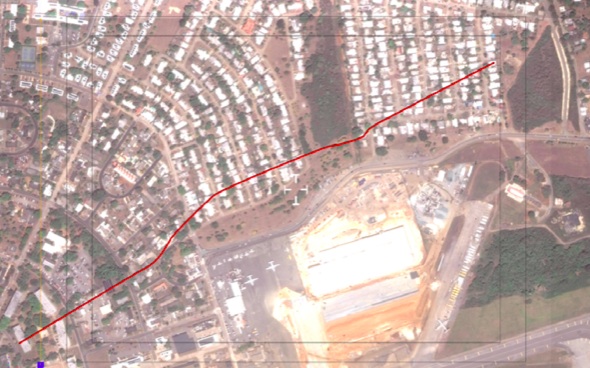
One of the posts that caught my eye early in our discussions came from Gilles Fernandez, who had posted some plots made by Florent Michaud They showed another possibility for the UAP’s track other than the large looping trajectory that the SCU team had suggested. While the track proposed by the SCU indicated an object that appeared to move against the wind at high speeds, Michaud’s work indicated a linear track over a small area. Encouraged by his diagrams, I decided to do an exercise using the data in the video. I created some plots where the azimuth of the UAP was close to center of the frame. Using the position of the plane and these sight lines11, I then created the following diagram:
Even though these positions do contain some error, they tend to indicate the general location of the target. The red arrow is the approximate path that I came up with based on these plots. This course implies the object displaced a distance of about 0.6 miles in 2 minutes and 20 seconds, which computes to be about 15 mph in a WSW direction. This is consistent with wind direction and speed. It seemed to me that this possibility needed to be considered. Instead, the SCU group chose a track that had the UAP basi-
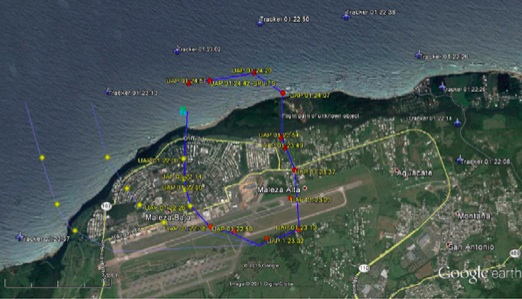
cally orbiting the airport in the same direction as the airplane as if it were on a big merry-go-round with the plane on one side and the UAP on the other.12 At no point in the paper did the SCU show the convergence of the sight lines over the airport indicating a more prosaic possibility. Either they chose not to mention it or were oblivious to it. Instead, they went out of their way to prove it was not a balloon.
It’s not a balloon
The SCU report devoted a section, appendix L, to demonstrate that the object was not a balloon. The arguments presented in this section are essentially based on one measurement that appears to be flawed.
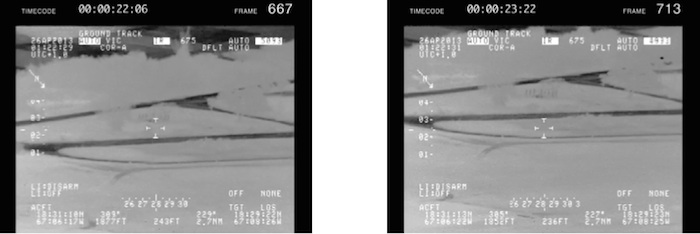
The SCU team picked frames 711 and 712 from the video to make their main argument.13 According to them, the background is stationary, which means the object is the only thing moving. I thought this calculation made a bad assumption because it did not appear to account for the plane’s motion. The plane was moving so the only way the background could be stationary is for the camera to compensate for this motion by rotating. Mr. Michaud pointed out to me that when one examines the relative bearing reading on the video clip during the time period, the relative bearing indicator and the azimuth on the display changed while the cross-hairs remain fixed on the same location. One can go all the way back to frame 667 to see this.14
.
If the camera is moving to compensate for the plane’s movement, then any motion of the UAP in the video could be related to the motion of the camera/plane and not the UAP itself. If the UAP were closer to the plane than the background and stationary (or rel- atively stationary), then the UAP would appear to move. The closer the object is to the camera, the greater amount of motion. The concept is called parallax and one can see it illustrated in this image (I exaggerated the angles in order to demonstrate the effect):
.
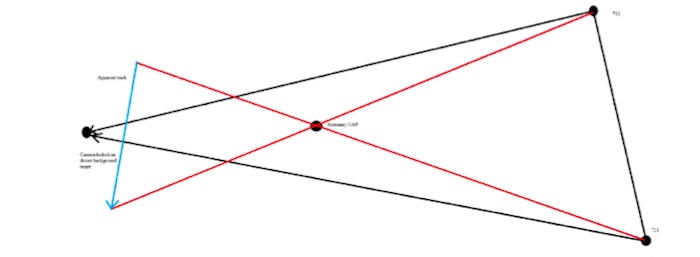
The change in azimuth in 46 frames is about 2 degrees. That indicates the camera was rotating to the left at about 0.04 degrees per frame. Interestingly, the displacement measured by the SCU team between frames 711 and 712 was .025 degrees. Considering the inability of the instrument to give precise measurements, the two values are close enough to consider them a pretty good match. This means it is very likely that the motion of the UAP between frames 711 and 712 is due to the motion of the camera rotating as the plane proceeded on its track. I could not even find the word “parallax” in the SCU report. This indicates they were not very thorough in their study or they deliberately left this possibility out of their report.
The secondary argument put forth by the SCU is that, if it were a balloon, the object was only 1250 feet from the plane. If that were the case, the angular motion would have been 68 degrees between the frames 711 and 836. Instead, the angular motion was only eight degrees. The writers seem sure about this 1250 foot argument and proceed to tell us why.15
According to their report the UAP was moving towards an azimuth of 188 degrees during this time period. This is based on the assumption that they correctly plotted the path of the UAP. As I stated previously, there seems to be evidence that another track was possible based on the sighting lines. However, that is not the key component of the SCU’s argument for the 1250 feet number. They rely on the measurements made between frames 711 and 712 for this. That measurement produces an angular motion of 0.25 degrees in 1/30th of a second. With the speed of the wind being 18 mph, the balloon would displace 0.88 feet in 1/30th of a second. Based on this assumption, the balloon had to be 1250 feet away in order to produce that much angular motion. The problem with the 1250 feet calculation is that it is based on the flawed assumption the camera was not rotating between frames 711 and 712. The evidence indicates otherwise, which makes this second argument invalid.
The whole argument that “this is not a balloon” appears to be based on a measurement that ignored some simple rules of geometry. Failure to recognize this indicates the science being used by the SCU team is a case of selecting only the data that appears to sup- port their arguments. This was evident in their subsequent rebuttal of the balloon explanation.
We told you....it is not a balloon!!!
After releasing their report, the opinion that this was a balloon was voiced by enough individuals that the SCU felt a need to re-
16 spond. Their rebuttal stated that it was impossible for a balloon to have been the object in the video.
.
In their argument, they selected only three data points to “prove” it was not a balloon. However, they did not consider the fact that the azimuth readings on the display are only to the nearest degree. Precise measurements of the kind described in their rebuttal are just not possible.
Despite these limitations, the SCU berates the balloon explanation proponents:
Duplication and verification on the basis of objective data is the essence of the scientific method.17
Their comment appears hypocritical because their rebuttal lists no specific frames or actual data so others can replicate their work. They simply plot it as if the reader was supposed to blindly accept their measurements.
Based on the line of sight paths and times they did give, I was able to determine that they probably used frames 20, 200, and 379 (inquiries by PRRR members indicated the frames were 15, 199, 379). The interesting thing about this is that, while frame 20 has the UAP in the center of the cross-hairs, frame 200 has the object to the right of center and frame 379 has the object to the left of center (15 and 199 were similar to 20 and 200). This means their sighting lines are incorrect. They did not compensate for the distance the UAP was from the center of the frame.18
.
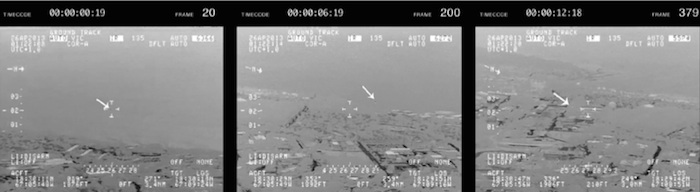
The distance from the center of the field of view shifts the frame 200 sight-line to the right and the frame 379 sight-line to the left. If one includes potential instrument error and the accuracy of the measurement, all three lines could be much closer together. The resultant computed speed of the object would be much slower than stated by the SCU.
The SCU team’s choice of only three data points is something I do not consider as being very scientific. Drawing a conclusion from such a meager amount of information is not an accurate way of analyzing data. The SCU team implies that they used more data points and it made the balloon hypothesis untenable. However, they chose not to demonstrate this. Instead, they repeated their complaint that any opposing hypotheses need to be backed up by more data.
We could draw a fourth line-of-sight and so on, which only makes the balloon hypothesis harder and harder to explain. This is what someone who supports a balloon hypothesis should do in order to determine if their hypothesis can fit the information at hand. As we noted at the beginning of this response, we are glad to examine any hypothesis but they must be put down in writing with the analysis, numbers, graphs, and diagrams to back the hypothesis and allow for secondary analysis.19
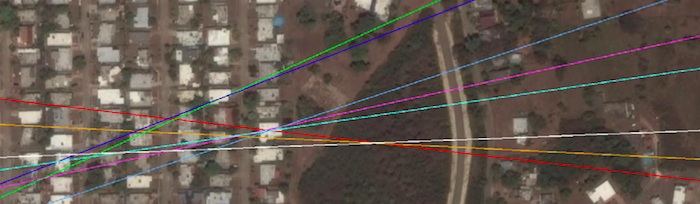
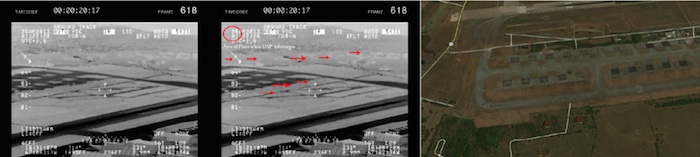
In an effort to demonstrate what happens when one uses more data, I selected eight data points over a period of slightly more than sixteen seconds. I only used data points where the cross hairs lined up on the target for the best possible precision (see images on next page).20 The lines all point to the same general region indicating the target was not moving that far.
.
.
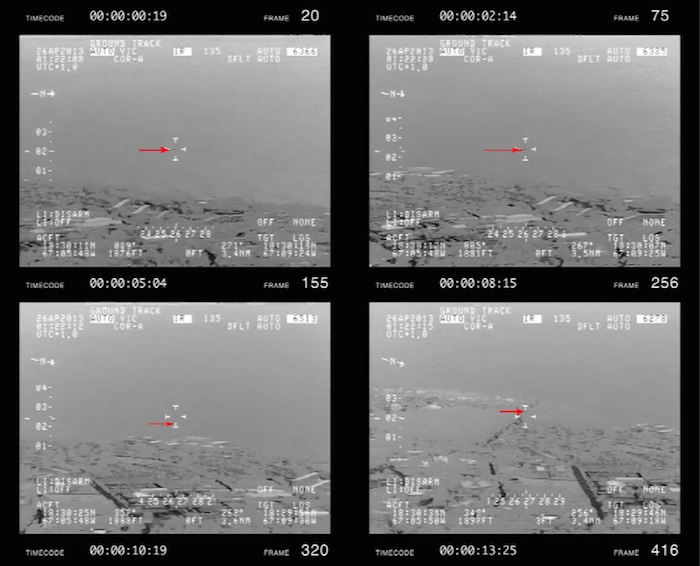
When we zoom in, one can see the region of intersection.
.
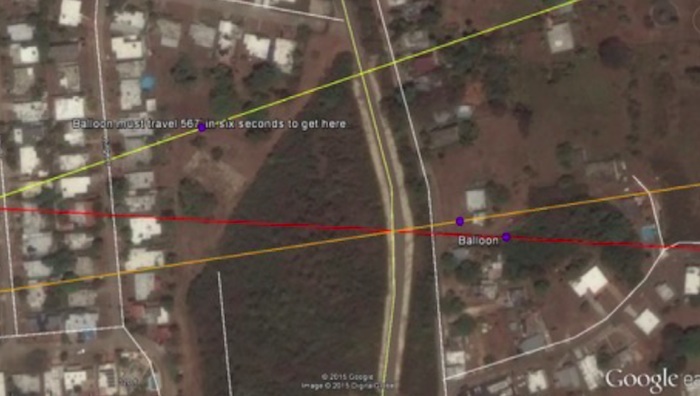
There are many lines that do not exactly line up but that is to be expected. The margin of measurement error is at least +/- 0.5 degree and shifting them a few tenths of a degree can make the sight lines line up. For instance, I adjusted one data point (Frame 20 - the red line) only 0.2 degrees CCW and it suddenly lined up with the other data points to provide us with a potential flight path along the red line (note: I am not stating that this is the actual path, just a possible path).
.
The length of this path along the red line is less than 600 feet in 16 seconds, which equates to about 25 mph. This is balloon-like speed and suggests that the object might have been a balloon.
Unlike the writers of the SCU report, I would never suggest this is conclusive proof for, or against, a balloon. There is just too much room for error to precisely locate the object using line of sight values. What this exercise does demonstrate is that the balloon hy- pothesis is not falsified contrary to what the SCU team wants everyone to believe. It also demonstrates that eight data points tends to gives us more precision than three.
To add to this discussion, there are other items that need to be considered that were not mentioned in any detail in the SCU’s rebut- tal. They take an effort to point out that the winds that night did not support a fast moving balloon. Their radiosonde data comes from San Juan, 60 miles to the east. While they might represent the winds possibly encountered by a balloon at this airport, they are not precise measurements. Once again, there is a margin for error not being considered. A radiosonde is a single data point sample of the atmosphere as the balloon rises. This snap shot does not indicate what the winds were for the entire 12 hour time period between balloon launchings or in the location the aircraft was flying. Therefore, suggesting that the maximum speed could only be 18mph, is not being quite correct. It could have been higher or lower than this value. It certainly could not have been 60 mph but it could have been 20-25 mph.
This second attempt by the SCU to falsify the balloon explanation was a failure. It drew a conclusion based upon a minimum num- ber of data points, it did not consider the accuracy of the device recording the data, and it selected data points that did not line up with the measuring device. It appears this paper was a case of confirmation bias. They presented/considered only the data that supported their argument and rejected/did not consider the data that suggested their conclusions might be wrong. It was “bad science” from a group claiming that they were interested only in scientifically analyzing the data.
There is no way it can be a balloon!
The SCU makes a point about how they can determine the distance to the object because it flies behind trees and telephone poles. Since the distance to these objects is known, it proves that the object was moving at high speed and could not be a balloon. While this is mentioned in the report, the SCU seems to avoid stating specific frames where the UAP disappears behind an object.
.
The SCU does give us one sequence of the UAP disappearing behind objects on pages 19 and 20.21 On those pages, the SCU shows three images, which gives the impression that between frames 2698 and 2712, the object is behind trees. However, the real fact of the matter is that the object is only invisible for a few frames (2704-6). In other frames it is faded (2702-3, 2707-8). During this entire time, the object is “behind” the trees for only three frames. Is it really behind the trees or is it possible there is another explanation?
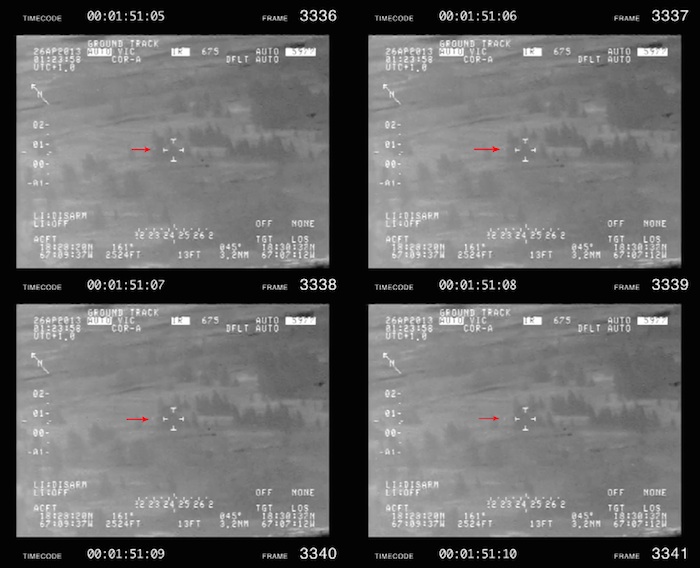
Another interpretation of what transpires is that the UAP merely blended into the background. This effect can be seen several times in the video if one watches the entire sequence. This fading is very prominent between frames 3300-3360, the UAP is not dark but pale white.22 It appears to fade away several times but is not behind any trees. This image sequence around frames 3336-3343 shows the object tends to fade from view (it is practically non-existent in frame 3340). It even passes in front of a tree, demonstrating it was not disappearing behind something.
It appears that these intermittent “disappearances” behind objects could be possibly due to the way the imager displayed the object against the background it was imaging. If this is accurate, then the measurements made by the SCU team for the object’s position are in error.
Balloons can’t swim!!!
The highlight of the SCU’s report is the UAP apparently submerging into the ocean. Appearances can be deceiving. This disap- pearing act may have not been due to the object diving into the ocean. I think there are two possibilities not discussed by the SCU team in their analysis.
The first has to do with the weather. The weather observations for that night was scattered clouds.23 This is mentioned in the SCU report but it is then ignored. That is unfortunate because there appears to evidence that these scattered clouds might have played a role in the apparent “submergence” sequence in the video.
.
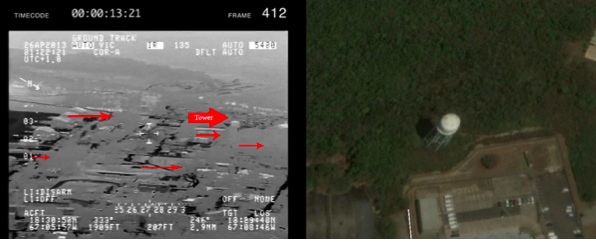
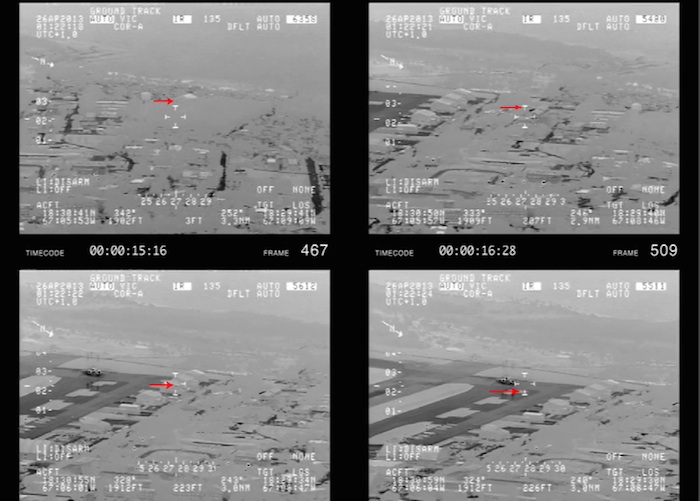
Examining the video, there appears to be clouds between the plane and ground tar- gets. Inframe412,weseethese“clouds”(red arrows).24 The SCU seems to either ignore them or determined that they were trees. Google earth has an image of the airport from March of 2013.25 In this image of the water tower (right), there are no tall trees that reach to the height of the tower as in the video. This indicates the objects are possibly low clouds that are between the plane and the water tower (large red arrow). They just
There is an interesting sequence that occurs between frames 200 and 300 as the UAP appears to disappear behind these clouds several times in the area near the water tower. This is consistent with these objects being clouds closer to the plane than the target and not trees.26
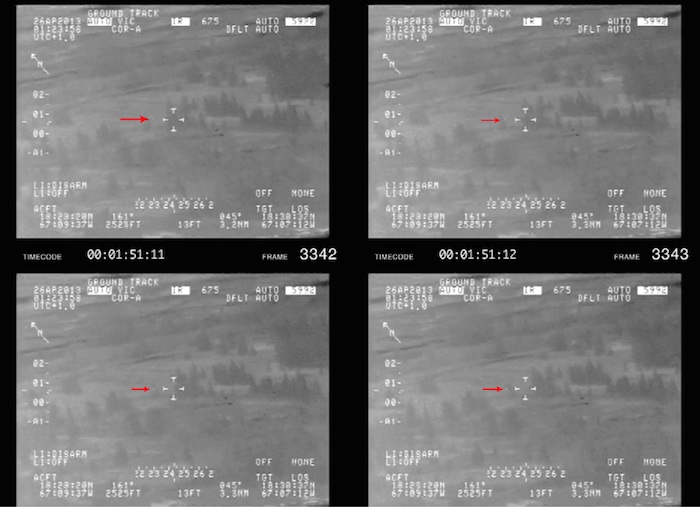
As previously pointed out, the section of frames between 3300 and 3360 exhibited the UAP fading out. In that imagery, there are trees in the background but the entire field appears to be faded and lacks contrast. This could be due to the camera looking through something like a clouds or fog or mist.27
This is an important item to consider when the UAP “submerges” at time 1:24:13 UTC (frame 3769). It seems possible that the UAP did not disappear into the water but disappeared behind some of the same clouds/fog/mist
that almost obscured the target in previous frames. 28
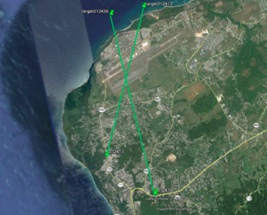
The position of the aircraft at the time of the submergence is important when attempting to examine the cloud explanation. One can see the location of the aircraft with the SCU lo- cation for the UAP in the image to the right. Note the crossing points for these observations are to the south side of the runway.
If there were clouds, they would have been visible in this region when the plane was north of the runway. This image looks towards the area where the LOS crosses at time 01:24:13UTC. Notice the various “trees” (red arrows) that are visible.29 However, there are no large trees in this area in the March 2013 Google image.30 This indicates the “trees” are, possibly, low
.
clouds between the plane and the ground. The red circle in the middle image is the general area the plane was located at the beginning of the UAP’s “submergence”. The plane would be moving towards the left in this image and have to look through these apparent clouds to see the target beyond them.
The only problem with this explanation is that there appears to be no clouds clearly visible in the video at the time of the UAP’s disappearance. In my opinion, the extreme zoom produces a lot of electronic noise and the ocean background does not provide adequate contrast to see the clouds. Earlier and later images of the UAP against the ocean at lower magnifications tend to show, what appear to be, clouds in the frames.
During the “submergence” sequence, the UAP disappears from the right and not the left as one might suspect from an object mov- ing towards the left and diving into the water.31 This is the kind of effect one would expect if there were something opaque, like a cloud, to the right of the object. As the plane’s motion went towards the right, the opaque object would cover the UAP from the right.
.
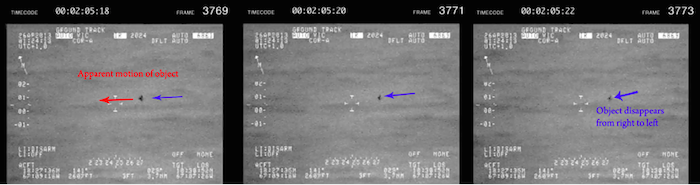
In their paper, the writers try and explain that this is the water coming up the rear as the object slowly submerges into the ocean.32 This is caused by an unseen portion of the object creating some sort of wake that hid the object from right to left. I am curious how a wake can overtake an object that, by the SCU’s calculations, did not slow down. One has to wonder why the SCU team needs to try and explain it at all since UAPs, by their definition, defy the laws of physics and nature. They might as well have concluded it was a cloaking device of some kind.
While I originally felt the cloud explanation was plausible, discussion with others in the PRRR had me thinking that was another, more likely, explanation for the “submergence effect”. The ability of the camera to sense the temperature signature of a target de- creases with increasing distance because the atmosphere scatters the Infrared emissions of a target. If the rough LOS path I plotted on page 6 is reasonably accurate, the plane was always about 2 miles from the target for most of the video and the background was the land. As the plane began to depart the area (around frame 3500), the distance to the target on the LOS Path increased to 2.5 miles and beyond. The target may have been simply fading into the ocean background and not “submerging” into the ocean.
According to the conclusions of the SCU report, the submergence of the UAP is one of the major items that demonstrates that this was something exotic. However, this sequence may be nothing more than the conditions of the environment and/or the capabili- ties of the camera when that section of the event was recorded.
Balloons don’t split into two!
Another argument against the balloon explanation is that, after the object reappears over the water, it is displayed as two differ- ent objects. A couple of theories have been presented that might explain this:
1. Viktor Golubic suggested it might have to do with a refractive layer of some kind.33
2. It is a second object. One theory suggested the UAP may have been two balloons tied together all along and they finally had separated. This seems unlikely because the object never clearly demonstrated that it was two separate objects until this point. While I don’t support this theory, it is a possibility that needs to be considered
3. It is an artifact of some kind in the video/camera system. This would require some technical expertise by somebody who is familiar with the system. At the time of this writing, no expert has publicly commented on the video. The SCU team has only presented us with comments from unnamed technicians34, who are not willing to go on the record.
All the options offered at present are really not adequate to explain what is appearing in the video. It could be any of these or some- thing else. Without more information it is difficult to say.
Balloons can not be hot!
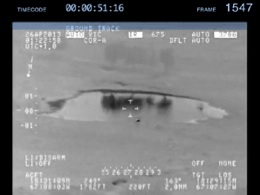
The balloon theory has another problem. The black target indicates some form of heat being emitted from the object. It is hard to say how well the imager records thermal signatures. On various occasions, the video
shows objects that are confusing. At frame 1547, there is a pond reflecting some trees that
appear to be emitting heat in the reflection but not above ground.35 Apparently, just because
an image is dark does not mean it is emitting a large amount of heat.
In appendix K, the SCU spends a great deal of time computing the heat signature of the UAP. Their computed temperature of the balloon is 105 degrees F (40.6 degree C).36 It is interesting to point out that the temperatures of birds is 105 degrees. Is it possible the object was a bird and not a balloon? One could suggest this possibility but the behavior of the object is more balloon like than bird-like. Still, that possibility can not be ignored.
.
While this temperature is pretty warm, it really is not excessively warm to fall outside the range of possibility that it was a balloon of some kind. It may have been that the balloon had some sort of small heat source inside or the “heat signature” may not be as warm as the SCU team has determined. We don’t have enough information to draw a conclusion on this part of the video. So far, the only “experts” that have publicly commented about the video appear to be unidentified technicians and engineers, who choose to be anonymous. Second hand reports of these kind really don’t carry much weight.
Maybe it is a balloon after all
While the SCU insists the object can not be a balloon, several members of the PRRR have reached the conclusion that it probably is a balloon. Line of sight plots tended to indicate the object was a balloon floating towards the southwest. Could it be proven that it was a balloon?
Lance Moody, in conjunction with Florent Michaud, put his skills to work in producing a 3D model of the plane, the terrain, and a potential balloon candidate. Several balloon paths have been computed by various individuals but, as I previously noted, a precise computation is difficult. Lance created this rough path in a West-Southwest direction to test the balloon explanation:
.
He assumed that the balloon had a size of 14 inches with an altitude of 245 +/-20 meters and a speed of 20 mph.37 Incorporating the known position of the plane, the direction the camera was looking, and approximate zoom levels he attempted to recreate the video using Maxon Cinema 4D.
.
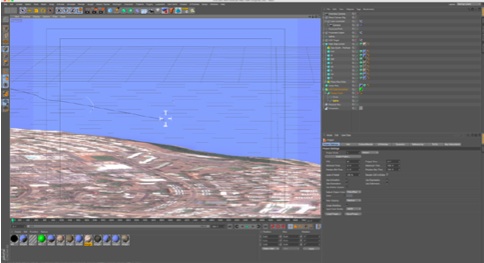
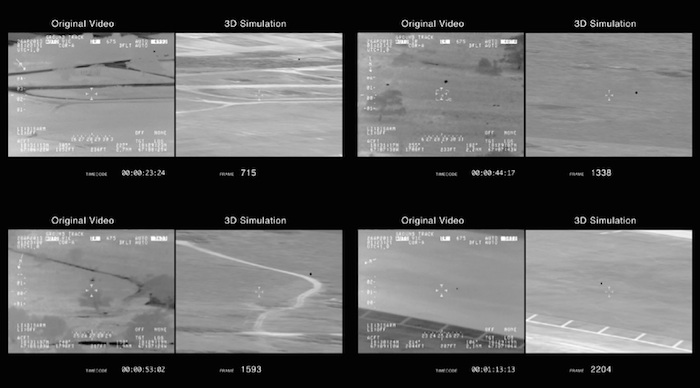
The result was very interesting and several members of the PRRR group were impressed. While there was some slight differences in elevation and position in some parts of the video, the final product was a reasonable match. It made a very convincing argument that the UAP could have been a balloon.
Lance is still refining his work but he did allow me to publish some stills from it. Lance assures me that he will be finished with the video soon. Like the upcoming Star Wars movie, readers of SUNlite will have to be satisfied with these “teasers” for now.
.
Fortsetzung...
Quelle: SUNlite 6/2015
5703 Views