
7.02.2017

The Larsen Ice Shelf is situated along the northeastern coast of the Antarctic Peninsula, one of the fastest-warming places on the planet. In the past three decades, two large sections of the ice shelf (Larsen A and B) have collapsed. A third section (Larsen C) seems like it may be on a similar trajectory, with a new iceberg poised to break away soon.
The mosaic above, centered on the northern part of Larsen Ice Shelf, is comprised of four natural-color satellite images captured by the Operational Land Imager (OLI) on Landsat 8 on Jan. 6 and 8, 2016. It shows the remnant of Larsen B, along with the Larsen A and smaller embayments to the north covered by a much thinner layer of sea ice. The remaining shelf appears white with some deep rifts within it.
Areas with sea ice anchored to the coastline or ice shelf—fast ice—are light blue where covered with melt water and white where covered by wind-blown snow. The ocean is dark, nearly black, where it is not covered by sea ice. The white areas near where glaciers meet the sea have multitudes of small icebergs called bergy bits that broke off from land ice.
---

On Nov. 10, 2016, scientists on NASA's IceBridge mission photographed an oblique view of a massive rift in the Antarctic Peninsula's Larsen C ice shelf. Icebridge, an airborne survey of polar ice, completed an eighth consecutive Antarctic deployment on Nov. 18.
Ice shelves are the floating parts of ice streams and glaciers, and they buttress the grounded ice behind them; when ice shelves collapse, the ice behind accelerates toward the ocean, where it then adds to sea level rise. Larsen C neighbors a smaller ice shelf that disintegrated in 2002 after developing a rift similar to the one now growing in Larsen C.
The IceBridge scientists measured the Larsen C fracture to be about 70 miles long, more than 300 feet wide and about a third of a mile deep. The crack completely cuts through the ice shelf but it does not go all the way across it – once it does, it will produce an iceberg roughly the size of the state of Delaware.
The mission of Operation IceBridge is to collect data on changing polar land and sea ice and maintain continuity of measurements between NASA's Ice, Cloud and Land Elevation Satellite (ICESat) missions. The original ICESat mission ended in 2009, and its successor, ICESat-2, is scheduled for launch in 2018. Operation IceBridge, which began in 2009, is currently funded until 2019. The planned overlap with ICESat-2 will help scientists validate the satellite’s measurements.
---

As scientists and crew with NASA’s Operation IceBridge mission prepared for a research flight on Nov. 5, 2016, the weather in Punta Arenas, Chile, was cold, wet, and windy. But when they reached their survey site in West Antarctica, skies were clear and winds were calm—a perfect day for scientists to collect data over the Getz Ice Shelf.
IceBridge, now in its eighth year, continues to build a record of how ice is responding to changes in the polar environment. The Getz Ice Shelf in West Antarctica is one area that scientists try to examine each year. “Getz is an ice shelf that has been experiencing some of the highest basal melt rates of the Antarctic ice shelves,” said Nathan Kurtz, IceBridge project scientist and a sea ice researcher at NASA’s Goddard Space Flight Center.
The image above shows a views of Getz as photographed on Nov. 5 from a NASA research airplane by Jeremy Harbeck, a sea ice scientist at NASA Goddard. The image shows ice in the process of calving from the front of the shelf, soon to become an iceberg.
Kurtz notes that the team has flown over the Getz Ice Shelf many times before. Flight paths are often exact repeats of those flown in previous years, which helps scientists understand how the height of the ice surface changes over time. This year, new flights over Getz were added to the existing observations. Scientists mapped the bathymetry (shape and depth of the seafloor) below the ice shelf, and they mapped the ice surface and bedrock upstream of the grounding line.
The flight over Getz is just one of a number of key areas flown during the IceBridge campaign. Each flight plan is prioritized in order of importance: baseline (the highest priority), high, medium, and low. The flight on Nov. 5 over Getz, for example, was categorized as “high” priority. Since the start of 2016 science flights on Oct.14, the team has flown six out of eight baseline missions, eight out of 15 high priority lines, and one medium and low priority mission each. Research flights for the season continue through Nov. 18.
“We are in pretty good shape so far, having flown so many missions due to a combination of favorable weather, no major airplane issues, and all instruments operating well,” Kurtz said. “We’re about four weeks into the campaign, and it’s possible we could tie the record of most flights flown with Operation IceBridge if things continue to go well.”
---
Glaciers and ice sheets move in unique and sometimes surprising patterns, as evidenced by a new capability that uses satellite images to map the speed of flowing ice in Greenland, Antarctica and mountain ranges around the world.
With imagery and data from Landsat 8, a joint mission of NASA and the U.S. Geological Survey, scientists are providing a near-real-time view of every large glacier and ice sheet on Earth. The NASA-funded Global Land Ice Velocity Extraction project, called GoLIVE, is a collaboration between scientists from the University of Colorado, the University of Alaska, and NASA’s Jet Propulsion Laboratory in Pasadena, California. It aims to better understand how ice flow is changing worldwide – and its impact on sea level.

"We are now able to map how the skin of ice is moving," said Ted Scambos, senior research scientist at the National Snow and Ice Data Center at the University of Colorado Boulder, and the Colorado lead for the GoLIVE project. He and his colleagues are releasing new results from the project at the American Geophysical Union’s Fall Meeting in San Francisco. "From now on, we’re going to be able to track all of the different types of changes in glaciers – there’s so much science to extract from the data."
With a near-real-time view of how glaciers and ice sheets are moving, researchers can integrate information about atmosphere and ocean conditions to determine what causes these ice sheets to change – and what that means for how much ice is flowing into the ocean. That could help provide critical information to coastal communities that will be most impacted by rising oceans.
“We can use the method to identify which areas to keep an eye on, or which events might lead to a rapid change,” Scambos said.
To map the ice, the GoLIVE team has written software that is able to follow the surface’s subtle features, like bumps or a dune-like pattern, as they flow toward the ocean. The Landsat 8 satellite collects images of Earth's entire surface every 16 days. By comparing images taken from the same location, but at different times, the researchers use their software to track the features and determine the speed.
Several new capabilities of Landsat 8 enable researchers to generate these global maps. The satellite can take 700 images a day – far more than its predecessors – which means it captures nearly every scene over land, every day, in all the sunlit parts of its orbit. Previous Landsat satellites often did not have the capacity to collect frequent data over remote sites like Antarctica. The imaging system on Landsat 8 is also far more sensitive than past Landsat sensors, allowing it to distinguish far more subtle differences in shading and surface texture. This, plus faster and more precise software, has revolutionized the extent to which ice flow speed can be mapped. These features will be continued in the Landsat 9 satellite, scheduled for launch in 2020.
Alaska
In Alaska, for example, researchers can observe surging glaciers in almost real time, said scientist Mark Fahnestock of the University of Alaska, Fairbanks. Often glaciers in Alaska and the Yukon are so remote that speedup events can go unnoticed for months, until a pilot flying over the region reports disrupted ice, he said.
“By measuring ice flow all the time, we can identify a surge as it starts, providing an entirely new way to follow this phenomenon," he said. “We can also follow large seasonal swings in tidewater glaciers, as they respond to their environment.”
Scientists need to see all of this variability in order to identify trends that we need to worry about,” Fahnestock said. The speed of the glacier, combined with other information such as elevation change from NASA’s Operation IceBridge campaign and other sources, provide researchers in Alaska with a better sense of the entire picture of changing ice.
Greenland
Twila Moon, a research scientist at the University of Bristol in the United Kingdom, uses the global maps to expand the research she does on Greenland glaciers. With the new database, she can study the movements of more than 240 glaciers, which comprise nearly all of the outlets from the ice sheet. Several glaciers in northwest Greenland have had accelerated speed in the last few years, while she saw some glaciers in the southeast experience a large jump in speed, followed by a plateau.


With Landsat 8 making a pass every 16 days, she can also measure seasonal changes. Most glaciers go in cyclic patterns throughout the year, but even those vary. While most speed up in the warmer summer months, Moon has found several that slow down dramatically in the mid- to late-summer. The Heimdal Glacier in southeast Greenland, for example, can move more than 10 meters per day (33 feet per day) in early summer, then drop to less than 6 meters per day (20 feet per day) by August or September.
“We can group these glaciers by looking at the similarities in their behavior,” Moon said. “It’s providing an opportunity to get at the underlying drivers of why they change.”
With measurements of what the seasonal shifts do to glacier speed, scientists can extrapolate what will happen to those glaciers as global temperatures continue to climb, she said. With fast-moving glaciers ending in the ocean, these studies can help scientists estimate how much new ice and water enters the Arctic Ocean. That new water can have both global and local impacts, changing the local ecosystems, ocean flow patterns and raising sea level.
“We’re approaching a point where we have enough detailed information at different locations that we can start to answer important questions about what makes glaciers tick,” Moon said.
Antarctica and high-mountain Asia
Scientists are working with the new Landsat data to better understand how different environmental changes in the atmosphere and ocean impact flowing ice, said Alex Gardner, a research scientist at NASA’s Jet Propulsion Laboratory. The Landsat 8 images, combined with earlier Landsat satellites reaching back to the 1980s, give researchers decades' worth of imagery to investigate these links.
“The question is, how sensitive are these ice sheets to changes in the atmosphere and the ocean?” Gardner said. “We could wait and see, or we could look to the past to help inform what is most likely to happen in the future.”
Gardner combines the detailed Antarctic ice cover seen by Landsat 8 with an earlier continental mapping of glacier flow based on radar data. By piecing the data together, he is working to understand decadal changes in ice flow for the entirety of the Antarctic Ice sheet.
Tracking the changes in speed in Antarctica is key because of the sheer size of the ice sheet and its potential to contribute to future changes in sea level. Almost 2,000 cubic kilometers (480 cubic miles) of ice flows into the surrounding ocean each year.
“Seemingly small changes in ice speed on some of these very large glaciers can have a real impact,” Gardner said.
Gardner and his colleagues have also mapped the glaciers in Karakoram and other high mountain ranges in Asia. There, they find that glacier flow is highly erratic with some glaciers, and others remain relatively unchanged over decadal timescales.
“It’s incredible how these seemingly unchanging glacier systems come alive when we look at their changes through time – they’re much more dynamic than you’d think,” Gardner said.
Quelle: NASA
-
Update: 12.02.2017
.
CRYOSAT REVEALS LAKE OUTBURSTS BENEATH ANTARCTIC ICE
A novel way of using ESA’s CryoSat mission has revealed how lakes beneath Thwaites Glacier drained into the Amundsen Sea – potentially the largest such outflow ever reported in this region of West Antarctica.
This new information is helping scientists understand more about what’s going on deep below the surface of the ice and what affects how fast the glaciers flow towards the ocean.
Thwaites and its neighbouring Pine Island Glacier are the fastest-receding glaciers on the Western Antarctic Ice Sheet.
Although this huge sheet is some 2 km thick in places, much of its floor is well below sea level. This makes it is particularly vulnerable to change, especially where the warmer ocean waters meet the underside of the floating terminus of the glacier.
Understanding the movements of these glaciers is critical for predicting how the ice sheet may behave in the future and how it may affect sea level.
A paper published today in The Cryosphere explains how CryoSat measurements have been processed in a new way and reveal that, in 2013, four interlinked lakes under Thwaites drained into the ocean.
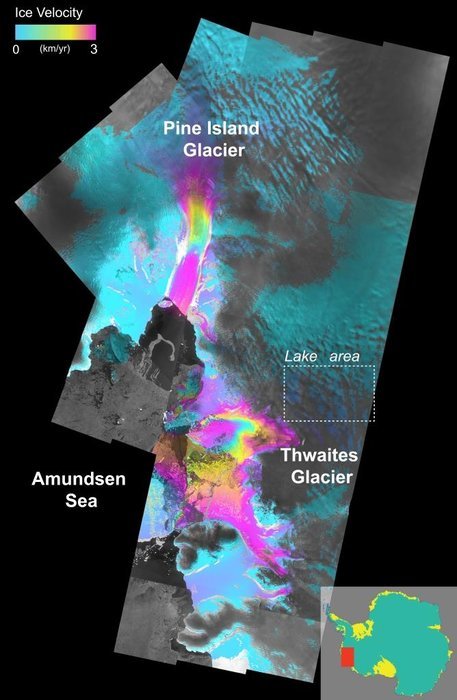
Lakes have been found under glaciers in many parts of Antarctica and are, indeed, commonly associated with fast-flowing glaciers. However, this is the first time they have been found and observed draining into the Amundsen Sea. In addition, this emptying is thought to happen only every 20–80 years.
Water below the ice sheet plays an important role in how quickly glaciers flow towards the sea, thought to be because a layer of meltwater reduces friction between the ice and the bedrock.
In addition, when channels form under the ice they lubricate the glacier bed.
Benjamin Smith from the University of Washington and lead author of the paper said, “This is first time we’ve been able to monitor both elevation changes and ice speed in this kind of detail over such a large area.
“Without a satellite like CryoSat, we would have probably have missed the lake draining and we would have had to guess how the lake drainage might have affected the ice speed.
“Together, they tell us about how water moving at the glacier bed affects ice speed, and what processes we need to understand so that we are better equipped to predict the future of Thwaites.”
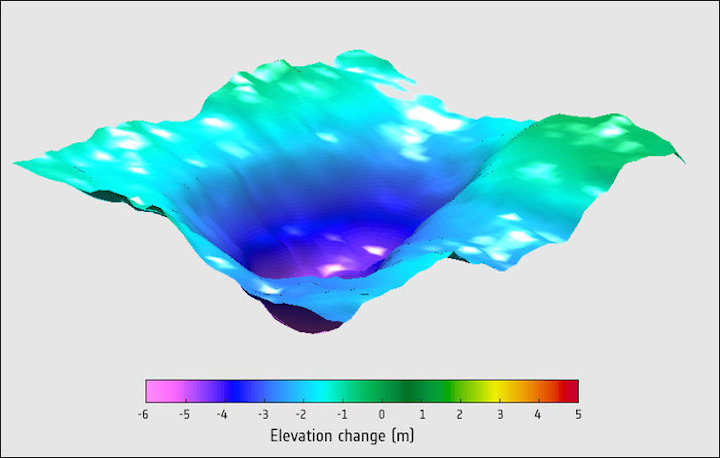
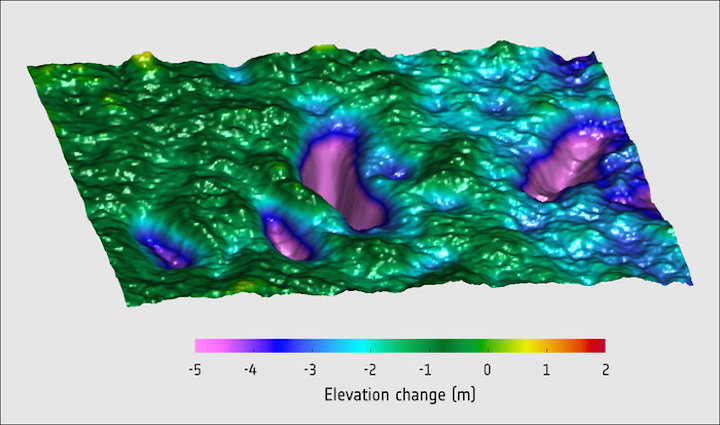
Noel Gourmelen from the University of Edinburgh explained, “Repeat observations from CryoSat over Thwaites revealed that the surface of the ice subsided by several metres as water drained away from the four lakes under the ice. The lakes totalled an area of about 700 sq km.
“On average, Thwaites carries about 135 cubic km of ice to the sea every year, but drainage from these lakes released an extra 3.5 cubic km of freshwater.
“In addition, the speed of the glacier increased by about 10% and would have contributed to a discharge of around 150 cubic km a year between 2013 and 2014.”
Drainage is estimated to have peaked at about 240 cubic m a second, possibly the largest outflow of meltwater ever reported from subglacial lakes in this region. This peak rate is about four times faster than the River Thames in England discharges to the North Sea each year.
Quelle: ESA