
.
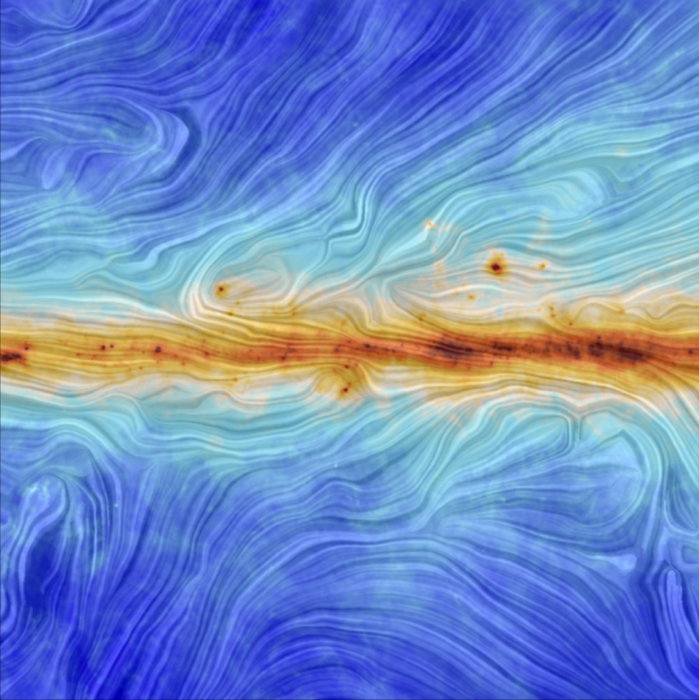
While the pastel tones and fine texture of this image may bring to mind brush strokes on an artist’s canvas, they are in fact a visualisation of data from ESA’s Planck satellite. The image portrays the interaction between interstellar dust in the Milky Way and the structure of our Galaxy’s magnetic field.
Between 2009 and 2013, Planck scanned the sky to detect the most ancient light in the history of the Universe – the cosmic microwave background. It also detected significant foreground emission from diffuse material in our Galaxy which, although a nuisance for cosmological studies, is extremely important for studying the birth of stars and other phenomena in the Milky Way.
Among the foreground sources at the wavelengths probed by Planck is cosmic dust, a minor but crucial component of the interstellar medium that pervades the Galaxy. Mainly gas, it is the raw material for stars to form.
Interstellar clouds of gas and dust are also threaded by the Galaxy’s magnetic field, and dust grains tend to align their longest axis at right angles to the direction of the field. As a result, the light emitted by dust grains is partly ‘polarised’ – it vibrates in a preferred direction – and, as such, could be caught by the polarisation-sensitive detectors on Planck.
Scientists in the Planck collaboration are using the polarised emission of interstellar dust to reconstruct the Galaxy’s magnetic field and study its role in the build-up of structure in the Milky Way, leading to star formation.
In this image, the colour scale represents the total intensity of dust emission, revealing the structure of interstellar clouds in the Milky Way. The texture is based on measurements of the direction of the polarised light emitted by the dust, which in turn indicates the orientation of the magnetic field.
This image shows the intricate link between the magnetic field and the structure of the interstellar medium along the plane of the Milky Way. In particular, the arrangement of the magnetic field is more ordered along the Galactic plane, where it follows the spiral structure of the Milky Way. Small clouds are seen just above and below the plane, where the magnetic field structure becomes less regular.
From these and other similar observations, Planck scientists found that filamentary interstellar clouds are preferentially aligned with the direction of the ambient magnetic field, highlighting the strong role played by magnetism in galaxy evolution.
The emission from dust is computed from a combination of Planck observations at 353, 545 and 857 GHz, whereas the direction of the magnetic field is based on Planck polarisation data at 353 GHz.
.
MILKY WAY'S MAGNETIC FINGERPRINT
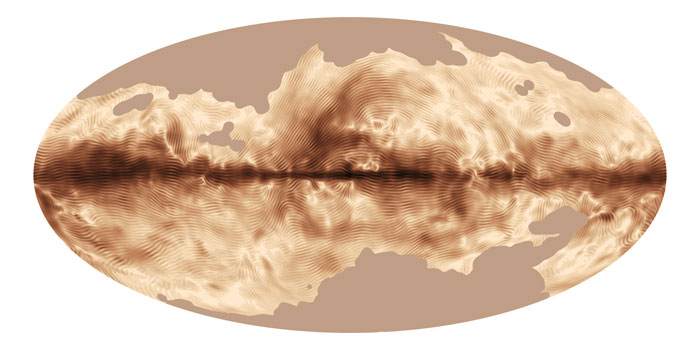
The magnetic field of our Milky Way Galaxy as seen by ESA’s Planck satellite. This image was compiled from the first all-sky observations of polarised light emitted by interstellar dust in the Milky Way. The magnetic field is displayed using a visualisation technique called line integral convolution (LIC).
Darker regions correspond to stronger polarised emission, and the striations indicate the direction of the magnetic field projected on the plane of the sky. The dark band running horizontally across the centre corresponds to the Galactic Plane. Here, the polarisation reveals a regular pattern on large angular scales, which is due to the magnetic field lines being predominantly parallel to the plane of the Milky Way. The data also reveal variations of the polarisation direction within nearby clouds of gas and dust. This can be seen in the tangled features above and below the plane, where the local magnetic field is particularly disorganised.
The image is a Mollweide projection of the full celestial sphere, with the plane of the Galaxy aligned with the horizontal axis of the oval. Certain areas in the image, mostly at high Galactic latitude, have been masked out. The overall intensity in these regions is low, complicating the separation of foreground and cosmic microwave background (CMB) components. Further data analysis will improve this by the time of the full data release in late 2014.
.
ALL-SKY IMAGE OF MOLECULAR GAS SEEN BY PLANCK AND PREVIOUS SURVEYS

This all-sky image shows the distribution of carbon monoxide (CO), a molecule used by astronomers to trace molecular clouds across the sky, as seen by Planck (blue). A compilation of previous surveys (Dame et al. (2001)), which left large areas of the sky unobserved, has been superimposed for comparison (red). The outlines identify the portions of the sky covered by these surveys.
Molecular clouds, dense and compact regions throughout the Milky Way where gas and dust clump together, represent one of the sources of foreground emission seen by Planck. The vast majority of gas in these clouds consists of molecular hydrogen (H2), and it is in these cold regions that stars are born. Since cold H2 does not easily radiate, astronomers trace these cosmic cribs across the sky by targeting other molecules, which are present there in very low abundance but radiate quite efficiently. The most important of these tracers is CO, which emits a number of rotational emission lines in the frequency range probed by Planck's High Frequency Instrument (HFI).
Emission lines affect a very limited range of frequencies compared to the broad range to which each of Planck’s detectors is sensitive, and are usually observed using spectrometers. But some CO lines are so bright that they actually dominate the total amount of light collected by certain detectors on Planck when they are pointed towards a molecular cloud.
The Planck image represents the first all-sky map of CO ever compiled. As highlighted in this image, the largest CO surveys thus far have concentrated on mapping the full extent of the Galactic Plane, where most clouds are concentrated, leaving large areas of the sky unobserved.
The CO map compiled with Planck shows concentrations of molecular gas in portions of the sky that have not been observed before, such as at high galactic latitudes, where clouds that are relatively close to the Solar System might be projected on the all-sky map. Planck's high sensitivity to CO also means that even very low-density clouds can be detected, and new details can be revealed in clouds that were already known.
Follow-up observations and further studies of these stellar nurseries will allow a detailed investigation of the physical and chemical conditions that lead to the formation of molecular clouds, shedding new light on the very early phases of star formation.
.
THE MICROWAVE SKY AS SEEN BY PLANCK WITH PREVIOUS RELEASES
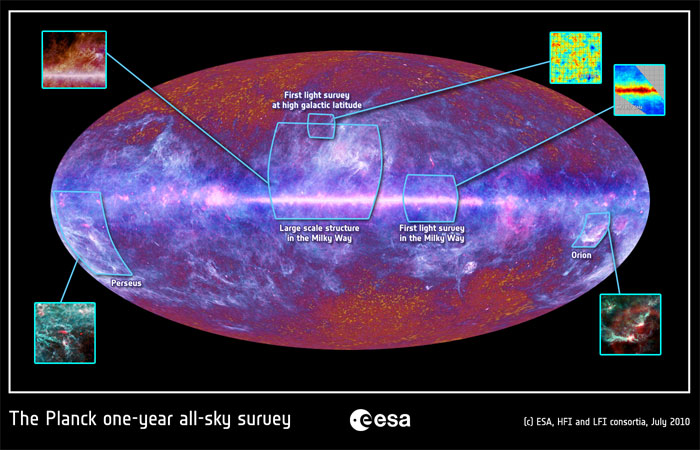
This multi-frequency all-sky image of the microwave sky has been composed using data from Planck covering the electromagnetic spectrum from 30 GHz to 857 GHz.
The mottled structure of the CMBR, with its tiny temperature fluctuations reflecting the primordial density variations from which today’s cosmic structure originated, is clearly visible in the high-latitude regions of the map.
The central band is the plane of our Galaxy. A large portion of the image is dominated by the diffuse emission from its gas and dust. The image was derived from data collected by Planck during its first all-sky survey, and comes from about 12 months of observations.
To the right of the main image, below the plane of the Galaxy, is a large cloud of gas in our Galaxy. The obvious arc of light surrounding it is Barnard’s Loop – the expanding bubble of an exploded star. Planck has seen whole other galaxies. The great spiral galaxy in Andromeda, 2.2 million light-years from Earth, appears as a sliver of microwave light, released by the coldest dust in its giant body. Other, more distant, galaxies with supermassive black holes appear as single points of microwaves dotting the image.
Derived from observations taken between August 2009 and June 2010, this image is a low-resolution version of the full data.
.
Quelle: ESA
5233 Views