
.
On March 29, 2014, an X-class flare erupted from the right side of the sun... and vaulted into history as the best-observed flare of all time. The flare was witnessed by four different NASA spacecraft and one ground-based observatory – three of which had been fortuitously focused in on the correct spot as programmed into their viewing schedule a full day in advance.
To have a record of such an intense flare from so many observatories is unprecedented. Such research can help scientists better understand what catalyst sets off these large explosions on the sun. Perhaps we may even some day be able to predict their onset and forewarn of the radio blackouts solar flares can cause near Earth – blackouts that can interfere with airplane, ship and military communications.
.
March 29 X-class Flare - 1
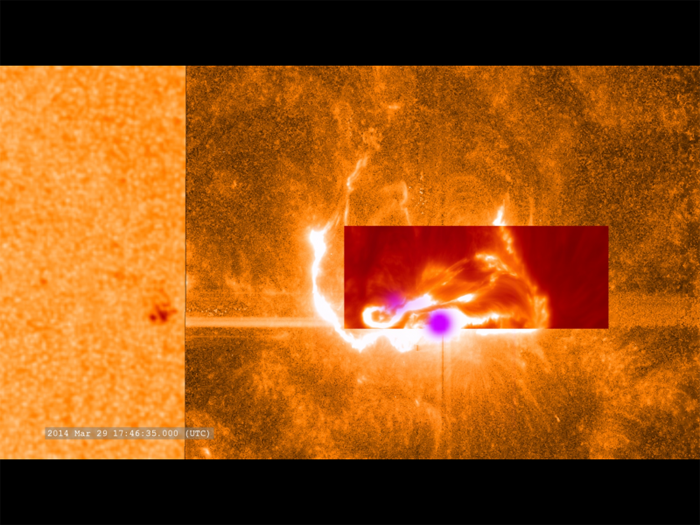
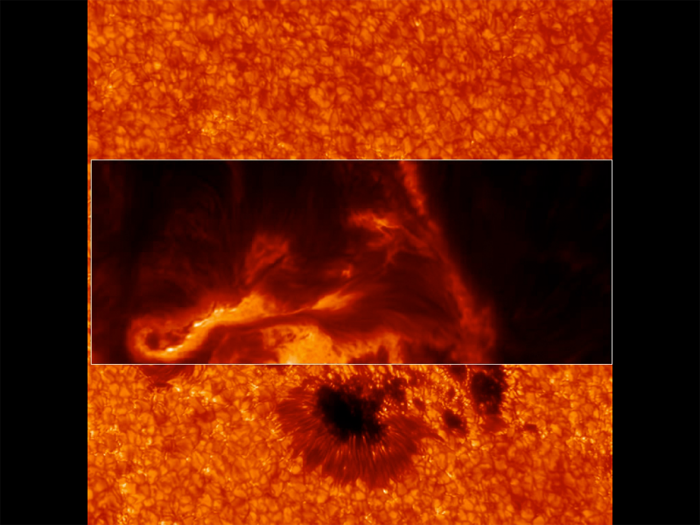
This combined image shows the March 29, 2014, X-class flare as seen through the eyes of different observatories. SDO is on the bottom/left, which helps show the position of the flare on the sun. The darker orange square is IRIS data. The red rectangular inset is from Sacramento Peak. The violet spots show the flare's footpoints from RHESSI.
.
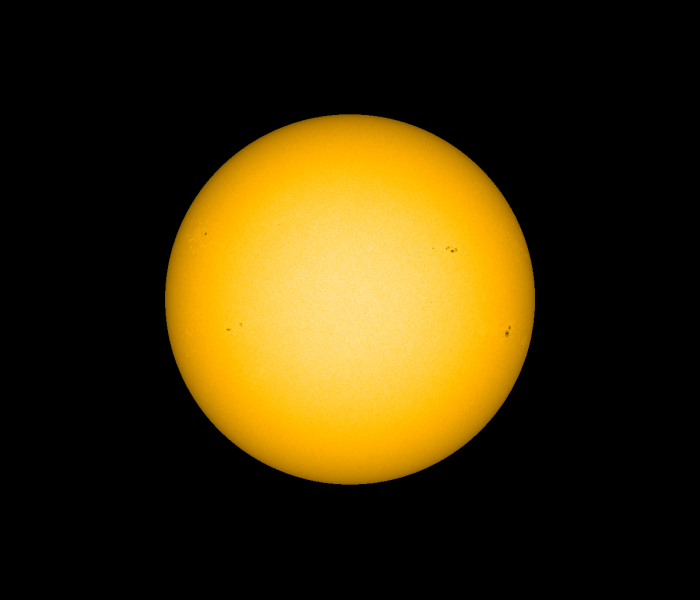
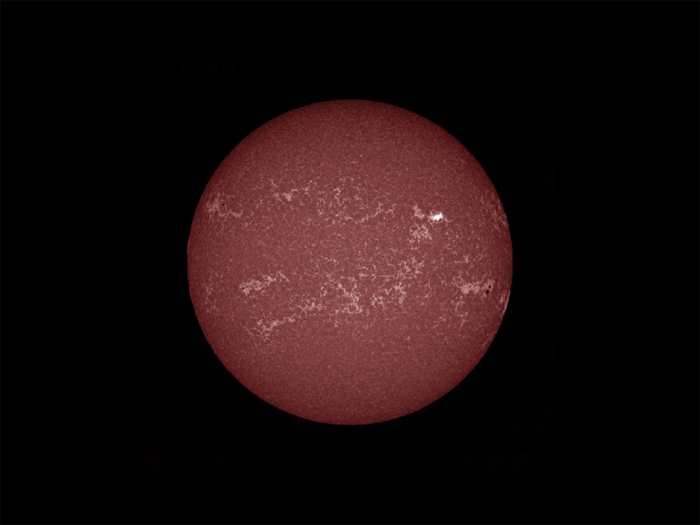
An image of the sun's surface, or photosphere, at 1:48 p.m. EDT on March 29, 2014, captured by the Helioseismic Magnetic Imager on NASA's Solar Dynamics Observatory. Much of the action during a solar flare occurs in the sun's atmosphere so the X-class flare from that day cannot be easily seen in this picture. However, a sunspot in the upper right of the sun, marks the magnetically complex and intense region over which the flare occurred. Credit: NASA/SDO/HMI
.
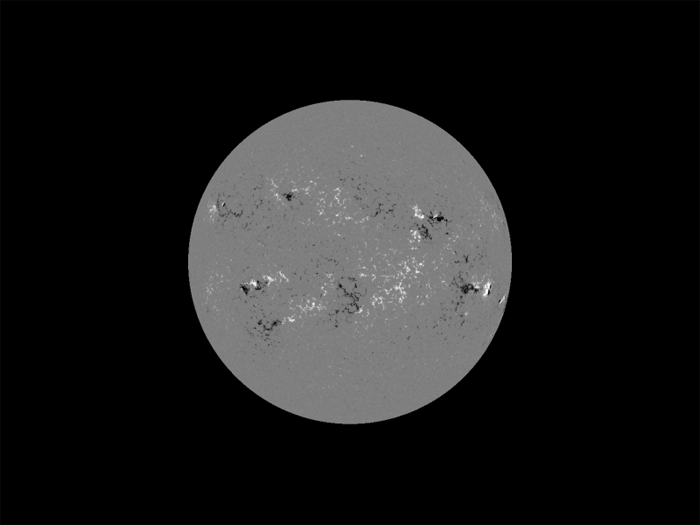
NASA's Solar Dynamics Observatory captures magnetic information about the surface of the sun. Dark areas in this image from 1:48 p.m. EDT on March 29, 2014, show where magnetic field lines point into the surface during the X-class flare. The white areas show where the field lines point out. This information helps unravel the complex magnetic system on and around the sun, which can lead to large eruptive events like solar flares. Credit: NASA/SDO/HMI
.
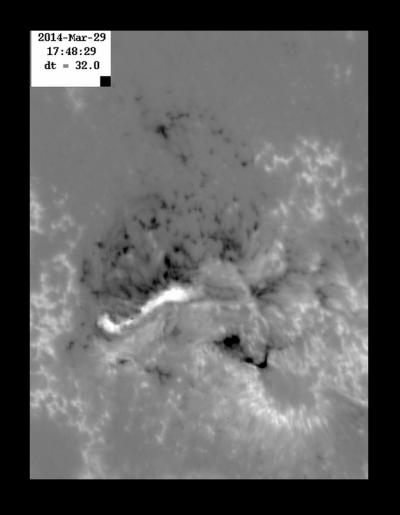
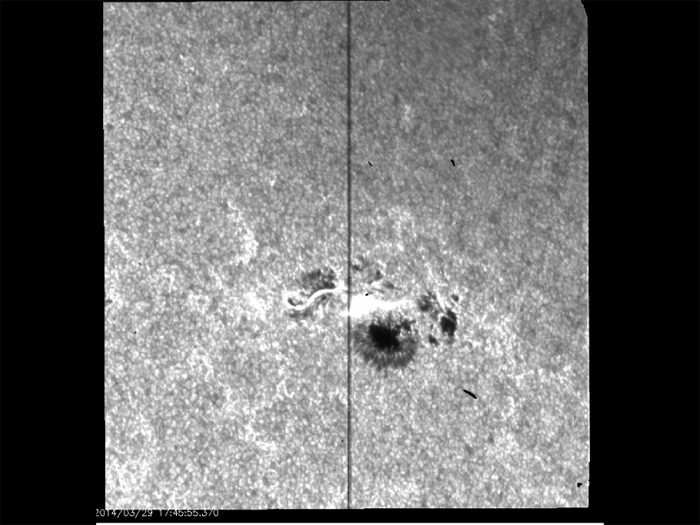
his image of the solar surface -- captured just as the flare peaked at 1:48 p.m. EDT, by the Solar Optical Telescope on the Japan Aerospace and Exploration Agency's and NASA's Hinode spacecraft – is what's called a magnetogram. The dark spots show where magnetic field lines travel in to the sun and the light regions show where they travel out. The intense white line on the left and the lower dark U-shape on the right, represent the footprints of the flare. Using these magnetograms, researchers were able to map the magnetic field's strength and direction change just before a flare in one of the highest resolution and best data sets ever gathered. Credit: JAXA/NASA/Hinode
.
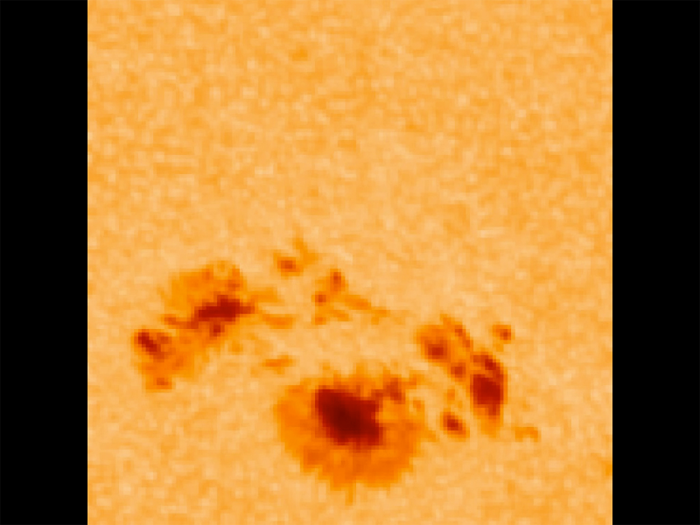
A closeup of the sunspot at the root of the March 29, 2014, X-class flare. This image was taken using NASA's Solar Dynamics Observatory – which specializes in capturing images of the entire sun. Zooming in on a spot like this shows some detail but not at extremely high resolution. Credit: NASA/SDO/HMI
.
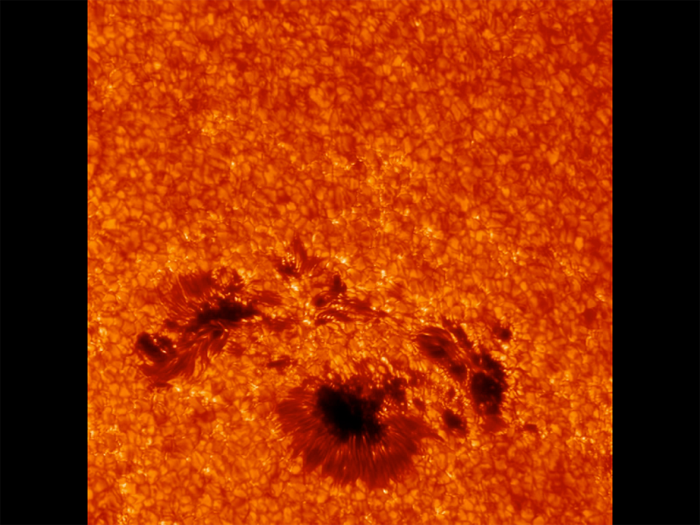
This close-up of the sunspot underneath the March 29, 2014, flare shows incredible detail. The image was captured by the G-band camera at Sacramento Peak in New Mexico. This instrument can focus on only a small area at once, but provide very high resolution. Ground-based telescope data can be hindered by Earth's atmosphere, which blocks much of the sun's ultraviolet and X-ray light, and causes twinkling even in the light it does allow through. As it happens, the March 29 flare occurred at a time of day in New Mexico that often results in the best viewing times from the ground.
Credit: Kevin Reardon (National Solar Observatory), Lucia Kleint (BAER Institute)
.
Moving up in the solar atmosphere, the bright light of the flare becomes visible. This image from the Atmospheric Imaging Assembly on NASA's Solar Dynamics Observatory shows ultraviolet light of 1700 Angstroms. This wavelength of light shows materials with temperatures of about 4500 Kelvin, which highlights the surface of the sun and a low layer of the sun's atmosphere called the chromosphere. Credit: NASA/SDO/AIA
.
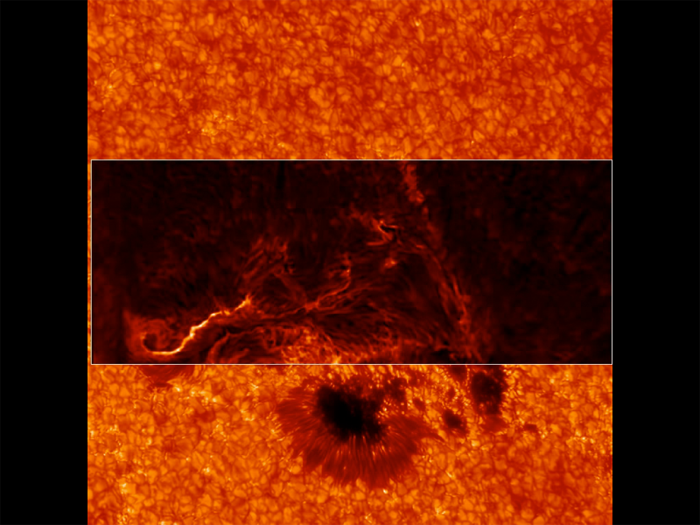
An image from the ground-based Interferometric Bidimensional Spectrometer, or IBIS, at the National Solar Observatory's Sacramento Peak is overlaid on an image of the sun's surface. A thin bright line can be seen on the left, which is known as a flare ribbon. This flare ribbon lies right over one of the footpoints of the flare seen in other images, such as those from NASA's RHESSI. The other footpoint isn't visible in this image.
Credit: Alberto Sainz Dalda (Stanford University), Kevin Reardon (NSO)
.
IBIS can focus in on different wavelengths of light, and so reveal different layers at different heights in the sun's lower atmosphere, the chromosphere. This image shows a region slightly higher than the former one.
Credit: Lucia Kleint (BAER Institute), Paul Higgins (Trinity College Dublin, Ireland)
.
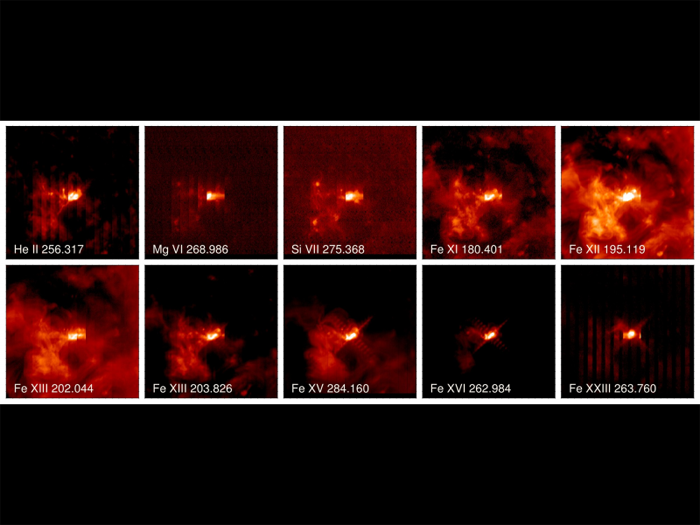
Each of these images from the Japan Aerospace Exploration Agency's and NASA's Hinode shows a progressively higher layer of the sun's atmosphere. The upper left corner shows material in a low part of the atmosphere, called the chromosphere – and the images progress ever upward through the heart of the flare up to over 3,000 miles above the surface in the image on the lower right. Each image shows a narrow swatch of the flare, which together can be combined to create a 3-dimensional picture. The images were captured by the EUV Imaging Spectrometer instrument on Hinode. Credit: JAXA/NASA/Hinode/EIS
.
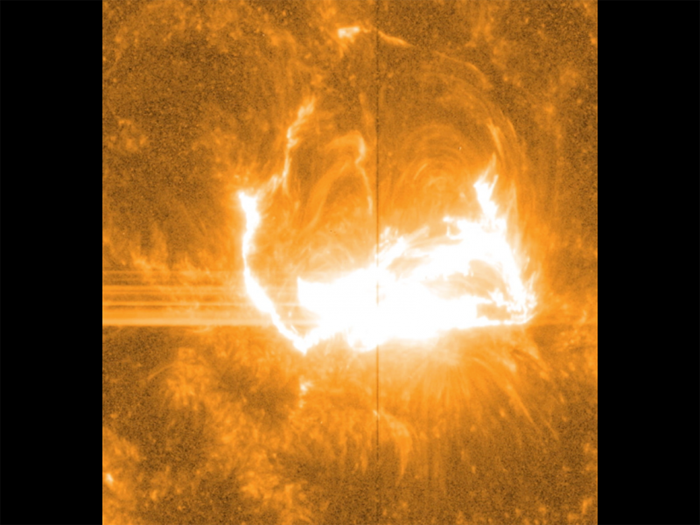
NASA's Interface Region Imaging Spectrograph, or IRIS, captured this image of the X-class flare. This is the first X-class flare that IRIS has ever observed, as the telescope's pointing must be programmed in at least a day in advance – too far ahead to know exactly where or when a flare might occur. With these observations, IRIS provided the first comprehensive data set of how heat and energy move through the low layers of the sun's atmosphere during an X-class flare. Credit: NASA/IRIS
.
Like almost all solar observatories, NASA's IRIS can provide images of different layers of the sun's atmosphere, which together create a whole picture of what's happening. This image shows light at a wavelength of 1400 Angstrom, which highlights material some 650 miles above the sun's surface. The vertical line in the middle shows the slit for IRIS's spectrograph, which can separate light into its many wavelengths to provide even more information about the temperature and velocity of material during a flare. Credit: NASA/IRIS/Goddard Space Flight Center
.
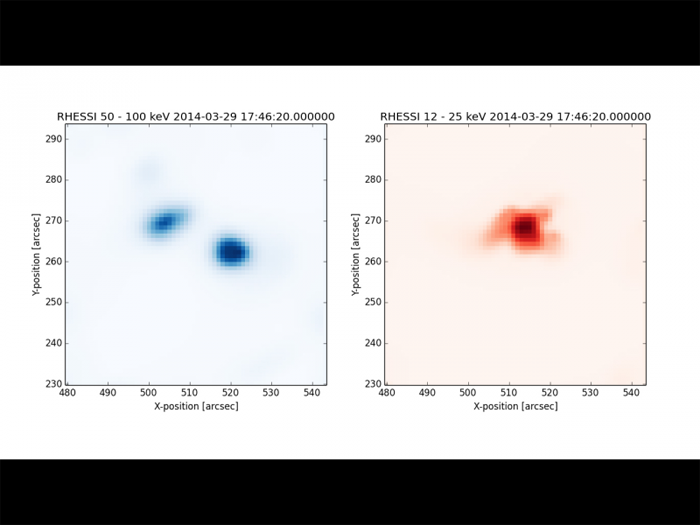
NASA's Reuven Ramaty High Energy Solar Spectroscopic Imager, or RHESSI, observes both the intense particle acceleration caused by the flare and the hottest temperature material. The image on the left shows where flare-accelerated electrons interact with the chromosphere at the footpoints of the flare, which are situated above the sunspots seen on the surface of the sun in other images. The image on the right shows the 25 million Kelvin material higher in the flare loop in the corona. Credit: NASA/RHESSI
.
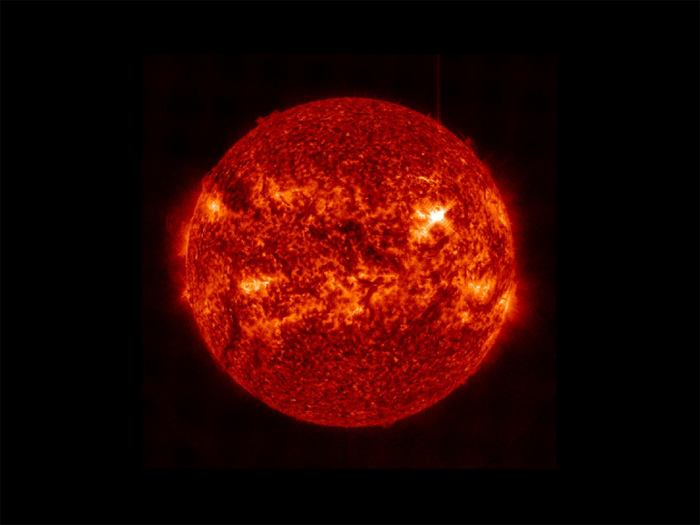
The March 29, 2014, X-class flare appears as a bright light on the upper right in this image from SDO, showing light in the 304 Angstrom wavelength. This wavelength shows material on the sun in what's called the transition region, where the chromosphere transitions into the upper solar atmosphere, the corona. Some light of the flare is clearly visible, but the flare appears brighter in other images that show hotter temperature material. Credit: NASA/SDO
.
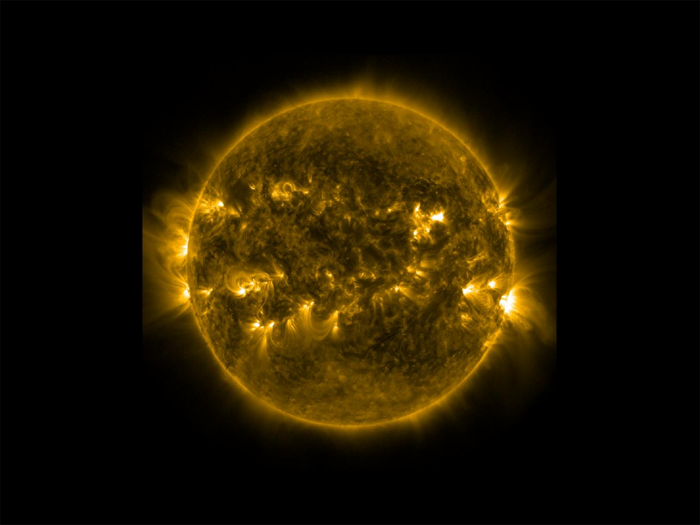
n these images of the solar corona showing light in the 171 Angstrom wavelength, the March 29, 2014, flare can barely be seen. However light in this wavelength does clearly show the beautiful loops of charged particles – tracing out the sun's magnetic field lines -- that can clearly be seen rising up on the sun's horizon. Credit:NASA/SDO
.
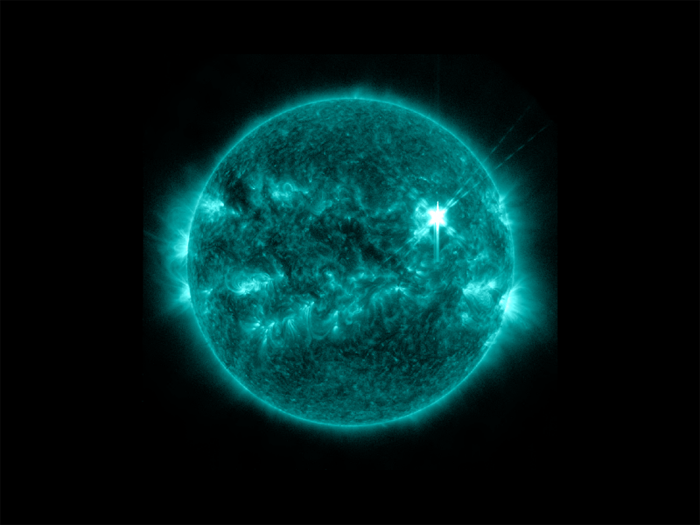
The hottest solar material that SDO can focus in on is 10 million Kelvin, as seen in this image that shows light with a wavelength of 131 Angstroms. At these temperatures, the blazingly hot solar flare can easily be seen in the upper right of the sun. Credit: NASA/SDO
.
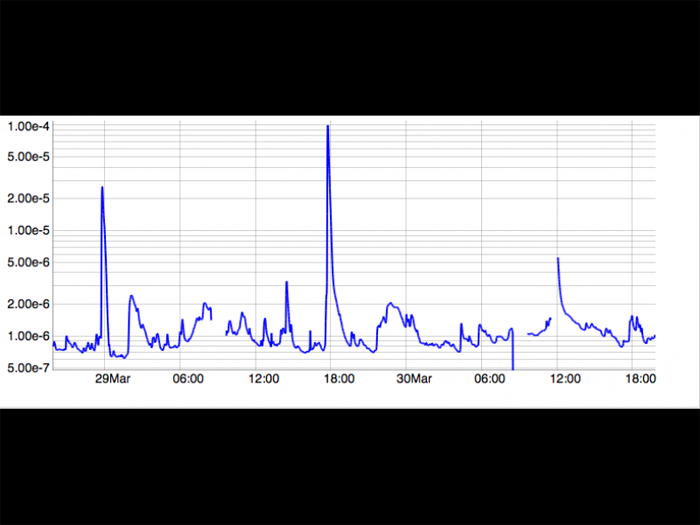
Not all solar observations come looking like pretty pictures. This data shoes how the National Oceanic and Atmospheric Administration's Geostationary Operational Environmental Satellite, or GOES, recorded the X-class flare. Note the high spike just before 18:00 – the Universal Time equivalent of 2:00 p.m. EDT -- on March 29. That spike shows how GOES detected a surge in X-rays from the sun, the signature of a solar flare. Credit: GOES
.
"This is the most comprehensive data set ever collected by NASA's Heliophysics Systems Observatory," said Jonathan Cirtain, project scientist for Hinode at NASA's Marshall Space Flight Center in Huntsville, Ala. "Some of the spacecraft observe the whole sun all the time, but three of the observatories had coordinated in advance to focus on a specific active region of the sun. We need at least a day to program in observation time and the target – so it was extremely fortunate that we caught this X-class flare."
Images and data from the various observations can be seen in the accompanying slide show. The telescopes involved were: NASA's Interface Region Imaging Spectrograph, or IRIS; NASA's Solar Dynamics Observatory, or SDO; NASA's Reuven Ramaty High Energy Solar Spectroscopic Imager, or RHESSI; the Japanese Aerospace Exploration Agency's Hinode; and the National Solar Observatory's Dunn Solar Telescope located at Sacramento Peak in New Mexico. Numerous other spacecraft provided additional data about what was happening on the sun during the event and what the effects were at Earth. NASA's Solar Terrestrial Relations Observatory and the joint European Space Agency and NASA's Solar and Heliospheric Observatory both watched the great cloud of solar material that erupted off the sun with the flare, an event called a coronal mass ejection. The U.S. National Oceanic and Atmospheric Administrations GOES satellite tracked X-rays from the flare, and other spacecraft measured the effects of the flare as it came toward Earth.
This event was particularly exciting for the IRIS team, as this was the first X-class flare ever observed by IRIS. IRIS launched in June 2013 to zoom in on layers of the sun, called the chromosphere and transition region, through which all the energy and heat of a flare must travel as it forms. This region, overall is called the interface region, has typically been very hard to untangle – but on March 29, IRIS provided scientists with the first detailed view of what happens in this region during a flare.
Coordinated observations are crucial to understanding such eruptions on the sun and their effects on space weather near Earth. Where terrestrial weather watching involves thousands of sensors and innumerable thermometers, solar observations still rely on a mere handful of telescopes. The instruments on the observatories are planned so that each shows a different aspect of the flare at a different heights off the sun's surface and at different temperatures. Together the observatories can paint a three-dimensional picture of what happens during any given event on the sun.
In this case, the Dunn Solar Telescope helped coordinate the space-based observatories. Lucia Kleint is the principal investigator of a NASA-funded grant at the Bay Area Environmental Research Institute grant to coordinate ground-based and space-based flare observations. While she and her team were hunting for flares during ten observing days scheduled at Sacramento Peak, they worked with the Hinode and IRIS teams a day in advance to coordinate viewing of the same active region at the same time. Active regions are often the source of solar eruptions, and this one was showing intense magnetic fields that moved in opposite directions in close proximity – a possible harbinger of a flare. However, researchers do not yet know exactly what conditions will lead to a flare so this was a best guess, not a guarantee.
But the guess paid off. In the space of just a few minutes, the most comprehensive flare data set of all time had been collected. Now scientists are hard at work teasing out a more detailed picture of how a flare starts and peaks – an effort that will help unravel the origins of these little-understood explosions on the sun.
Quelle: NASA
5155 Views