

.
19.03.2014
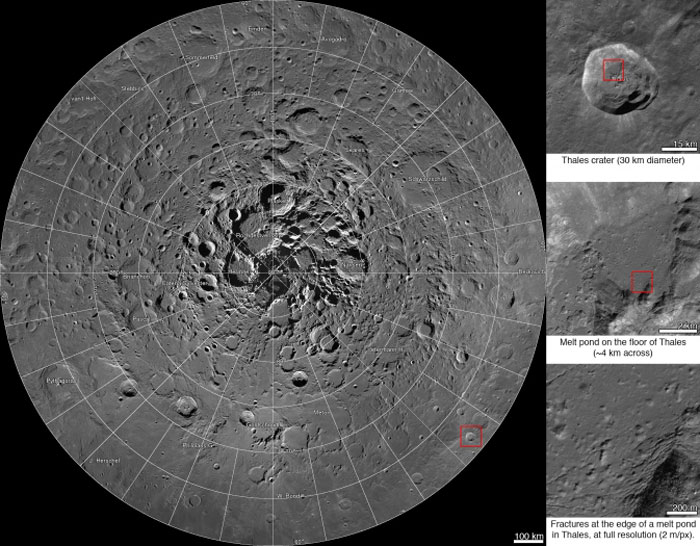
A new interactive mosaic from NASA's Lunar Reconnaissance Orbiter covers the north pole of the moon from 60 to 90 degrees north latitude at a resolution of 6-1/2 feet (2 meters) per pixel. Close-ups of Thales crater (right side) zoom in to reveal increasing levels of detail.
Image Credit: NASA/GSFC/Arizona State University
.
Scientists, using cameras aboard NASA's Lunar Reconnaissance Orbiter (LRO), have created the largest high resolution mosaic of our moon’s north polar region. The six-and-a-half feet (two-meters)-per-pixel images cover an area equal to more than one-quarter of the United States.
Web viewers can zoom in and out, and pan around an area. Constructed from 10,581 pictures, the mosaic provides enough detail to see textures and subtle shading of the lunar terrain. Consistent lighting throughout the images makes it easy to compare different regions.
"This unique image is a tremendous resource for scientists and the public alike," said John Keller, LRO project scientist at NASA's Goddard Space Flight Center, Greenbelt, Md. "It's the latest example of the exciting insights and data products LRO has been providing for nearly five years."
The images making up the mosaic were taken by the two LRO Narrow Angle Cameras, which are part of the instrument suite known as the Lunar Reconnaissance Orbiter Camera (LROC). The cameras can record a tremendous dynamic range of lit and shadowed areas.
"Creation of this giant mosaic took four years and a huge team effort across the LRO project," said Mark Robinson, principal investigator for the LROC at Arizona State University in Tempe. "We now have a nearly uniform map to unravel key science questions and find the best landing spots for future exploration."
The entire image measures 931,070 pixels square – nearly 867 billion pixels total. A complete printout at 300 dots per inch – considered crisp resolution for printed publications – would require a square sheet of paper wider than a professional U.S. football field and almost as long. If the complete mosaic were processed as a single file, it would require approximately 3.3 terabytes of storage space. Instead, the processed mosaic was divided into millions of small, compressed files, making it manageable for users to view and navigate around the image using a web browser.
LRO entered lunar orbit in June 2009 equipped with seven instrument suites to map the surface, probe the radiation environment, investigate water and key mineral resources, and gather geological clues about the moon's evolution.
Researchers used additional information about the moon's topography from LRO's Lunar Orbiter Laser Altimeter, as well as gravity information from NASA's Gravity Recovery and Interior Laboratory (GRAIL) mission, to assemble the mosaic. Launched in September 2011, the GRAIL mission, employing twin spacecraft named Ebb and Flow, generated a gravity field map of the moon -- the highest resolution gravity field map of any celestial body.
LRO is managed by Goddard for the Science Mission Directorate (SMD) at NASA Headquarters in Washington. LROC was designed and built by Malin Space Science Systems and is operated by the University of Arizona. NASA's Jet Propulsion Laboratory in Pasadena, Calif., managed the GRAIL mission for SMD.
Quelle: NASA
.
Update: 20.03.2014
.
ASU camera creates stunning mosaic of moon's polar region
.
.
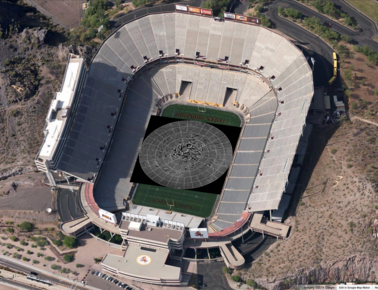
Printed at 300 dpi (a high-quality printing resolution that requires you to peer very closely to distinguish pixels), the LROC northern polar mosaic would be larger than a football field.
.
Today, the Lunar Reconnaissance Orbiter Camera (LROC), run by the Arizona State University-based team under professor Mark Robinson, released what very well may be the largest image mosaic available on the web. This map offers a complete picture of the moon’s northern polar region in stunning detail.
On December 11, 2011, after two and a half years in a near-circular polar orbit, NASA’s Lunar Reconnaissance Orbiter (LRO) entered an elliptical polar orbit, with the periapsis (point where the LRO is closest to the surface) near the south pole, and the apoapsis (point where LRO is furthest from the surface) near the north pole of the moon. The increased altitude over the northern hemisphere enables the two narrow angle cameras and the wide angle camera to capture more terrain in each image acquired in the northern hemisphere.
The resulting LROC northern polar mosaic is comprised of 10,581 narrow angle camera images, collected over four years, and covers the latitude range of zero to 60 degrees north.
In the fall of 2010, the LROC team produced its first mosaic of the moon’s northern polar region, but it doesn’t even compare to this new mosaic, with its 50-times-higher resolution, and over 680 gigapixels of valid image data covering a region of the moon slightly larger than the combined area of Alaska and Texas – at a resolution of 2 meters per pixel.
To create the mosaic, each LROC narrow angle camera image was map projected on a 30-meters-per-pixel lunar orbiter laser altimeter-derived digital terrain model using a software package (written by the United States' Geological Survey) called Integrated Software for Imagers and Spectrometers.
The northern polar mosaic was assembled from individual “collar” mosaics. Each collar mosaic was acquired by imaging the same latitude once every two-hour orbit for a month, during which time the rotation of the moon steadily brought every longitude into view. Each collar mosaic has very similar lighting from start to end, and covers 1 to 3 degrees of latitude.
The mosaic was originally assembled as 841 large tiles, due to the sheer volume of data. If the mosaic was processed as a single file, it would have been approximately 3.3 terabytes in size. Part of the large size is due to the incredible dynamic range of the narrow angle cameras. The raw images are recorded as 12-bit data (4,096 gray levels), then processed to normalized reflectance (a quantitative measure of the percentage of light reflected from each spot on the ground).
To preserve the subtle shading gradations of the raw images during processing, the narrow angle camera images are stored as 32-bit, floating-point values (millions of gray levels). The 32-bit values are four times the disk size of the finalized 8-bit (255 gray levels) representation most computers use to display grayscale images. The conversion process from 32-bit to 8-bit pixels results in saturation (a group of pixels all with the maximum value of 255) in the brightest areas.
Even with the conversion, the compressed JPEG images that make up the final product take up almost a terabyte of disk space.
In total, the massive mosaic required 17,641,035 small tiles to produce the final product.
“The (northern polar mosaic) is another example of LRO observations paving the way for science discoveries and future missions of exploration. Creation of this giant mosaic took four years and a huge team effort across the LRO project. We now have a nearly uniform map to unravel key science questions and find the best landing spots for future exploration,” says Robinson, a professor in the School of Earth and Space Exploration in ASU’s College of Liberal Arts and Sciences.
.
.
Quelle:Arizona State University
4931 Views